


Mutational Signatures (v3.6 - May 2026)
SBS28 · GRCh37 · COSMIC v104
Mutational profile

Genome: GRCh37

Genome: GRCh38

Genome: mm9

Genome: mm10

Genome: rn6
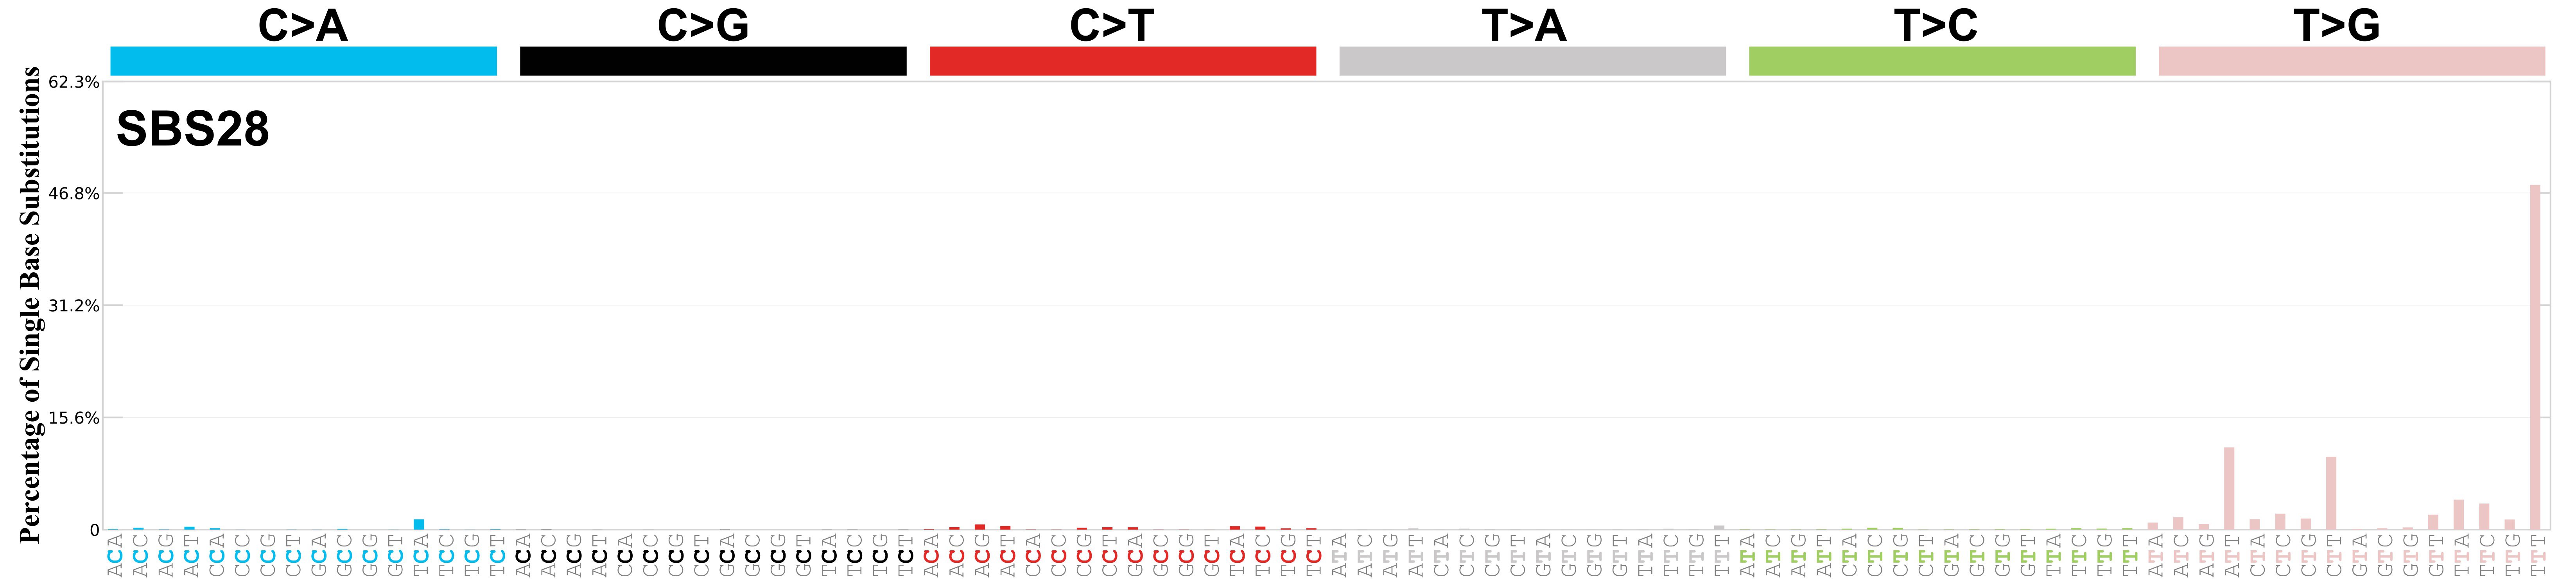
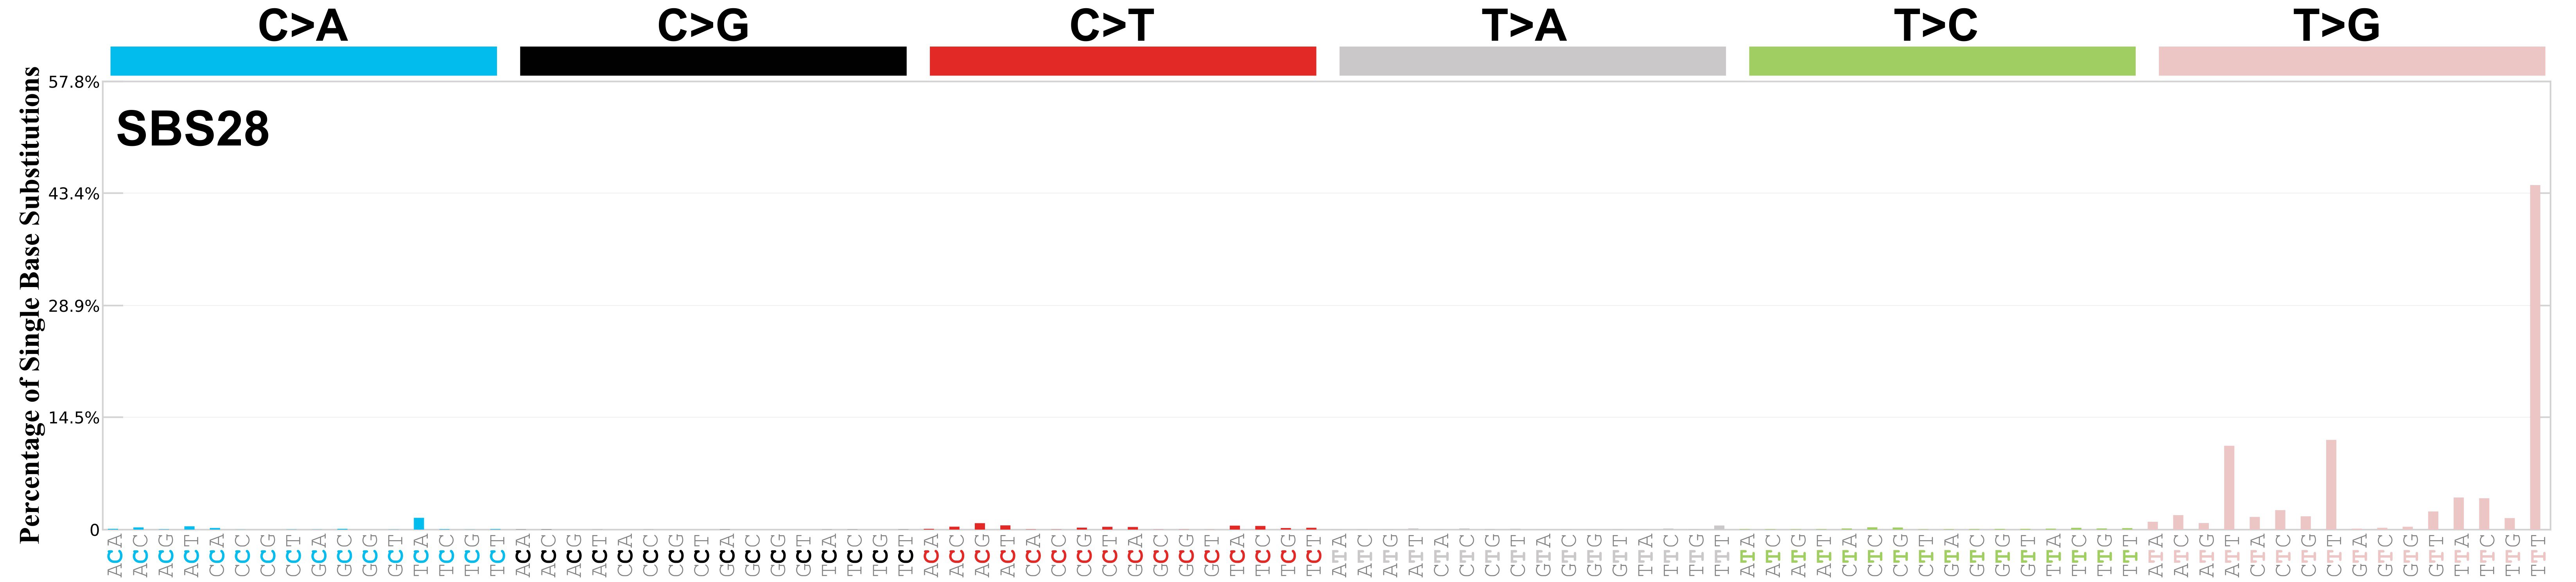
Mutational profile using the conventional 96 mutation type classification. This classification is based on the six substitution subtypes: C>A, C>G, C>T, T>A, T>C, and T>G, as well as the nucleotides immediately 5’ and 3’ to the mutation.
Each of the substitutions is referred to by the pyrimidine of the mutated Watson—Crick base pair. Incorporating information on the bases immediately 5’ and 3’ to each mutated base generates 96 possible mutation types (6 types of substitution x 4 types of 5’ base x 4 types of 3’ base). Mutational signatures are displayed and reported based on the observed trinucleotide frequency of the genome, i.e., representing the relative proportions of mutations generated by each signature based on the actual trinucleotide frequencies of the corresponding reference genome.
Proposed aetiology
Unknown.
Comments
SBS28 has similarities to SBS17b and these two signatures can be mistaken for one another. Signature SBS28 is found in most samples with SBS10a/SBS10b where it contributes very high numbers of mutations. In contrast, SBS28 contributes much smaller number of mutations in samples lacking SBS10a/SBS10b .
Acceptance criteria
| Background | Identification study | First included in COSMIC | |
|---|---|---|---|
| Alexandrov et al. 2015 Nature Genetics / Nik-Zainal et al. 2016 Nature | v2 | ||
| Identification | NGS technique | Different variant callers | Multiple sequencing centres |
| WES & WGS | Yes | Yes | |
| Technical validation | Validated in orthogonal techniques | Replicated in additional studies | Extended context enrichment |
| Yes | Yes | - | |
| Proposed aetiology | Mutational process | Support | |
| POLE exonuclease domain mutation | Experimental studies | ||
| Experimental validation | Experimental study | Species | |
| Hodel et al. 2020 Molecular Cell | Human | ||
Tissue distribution
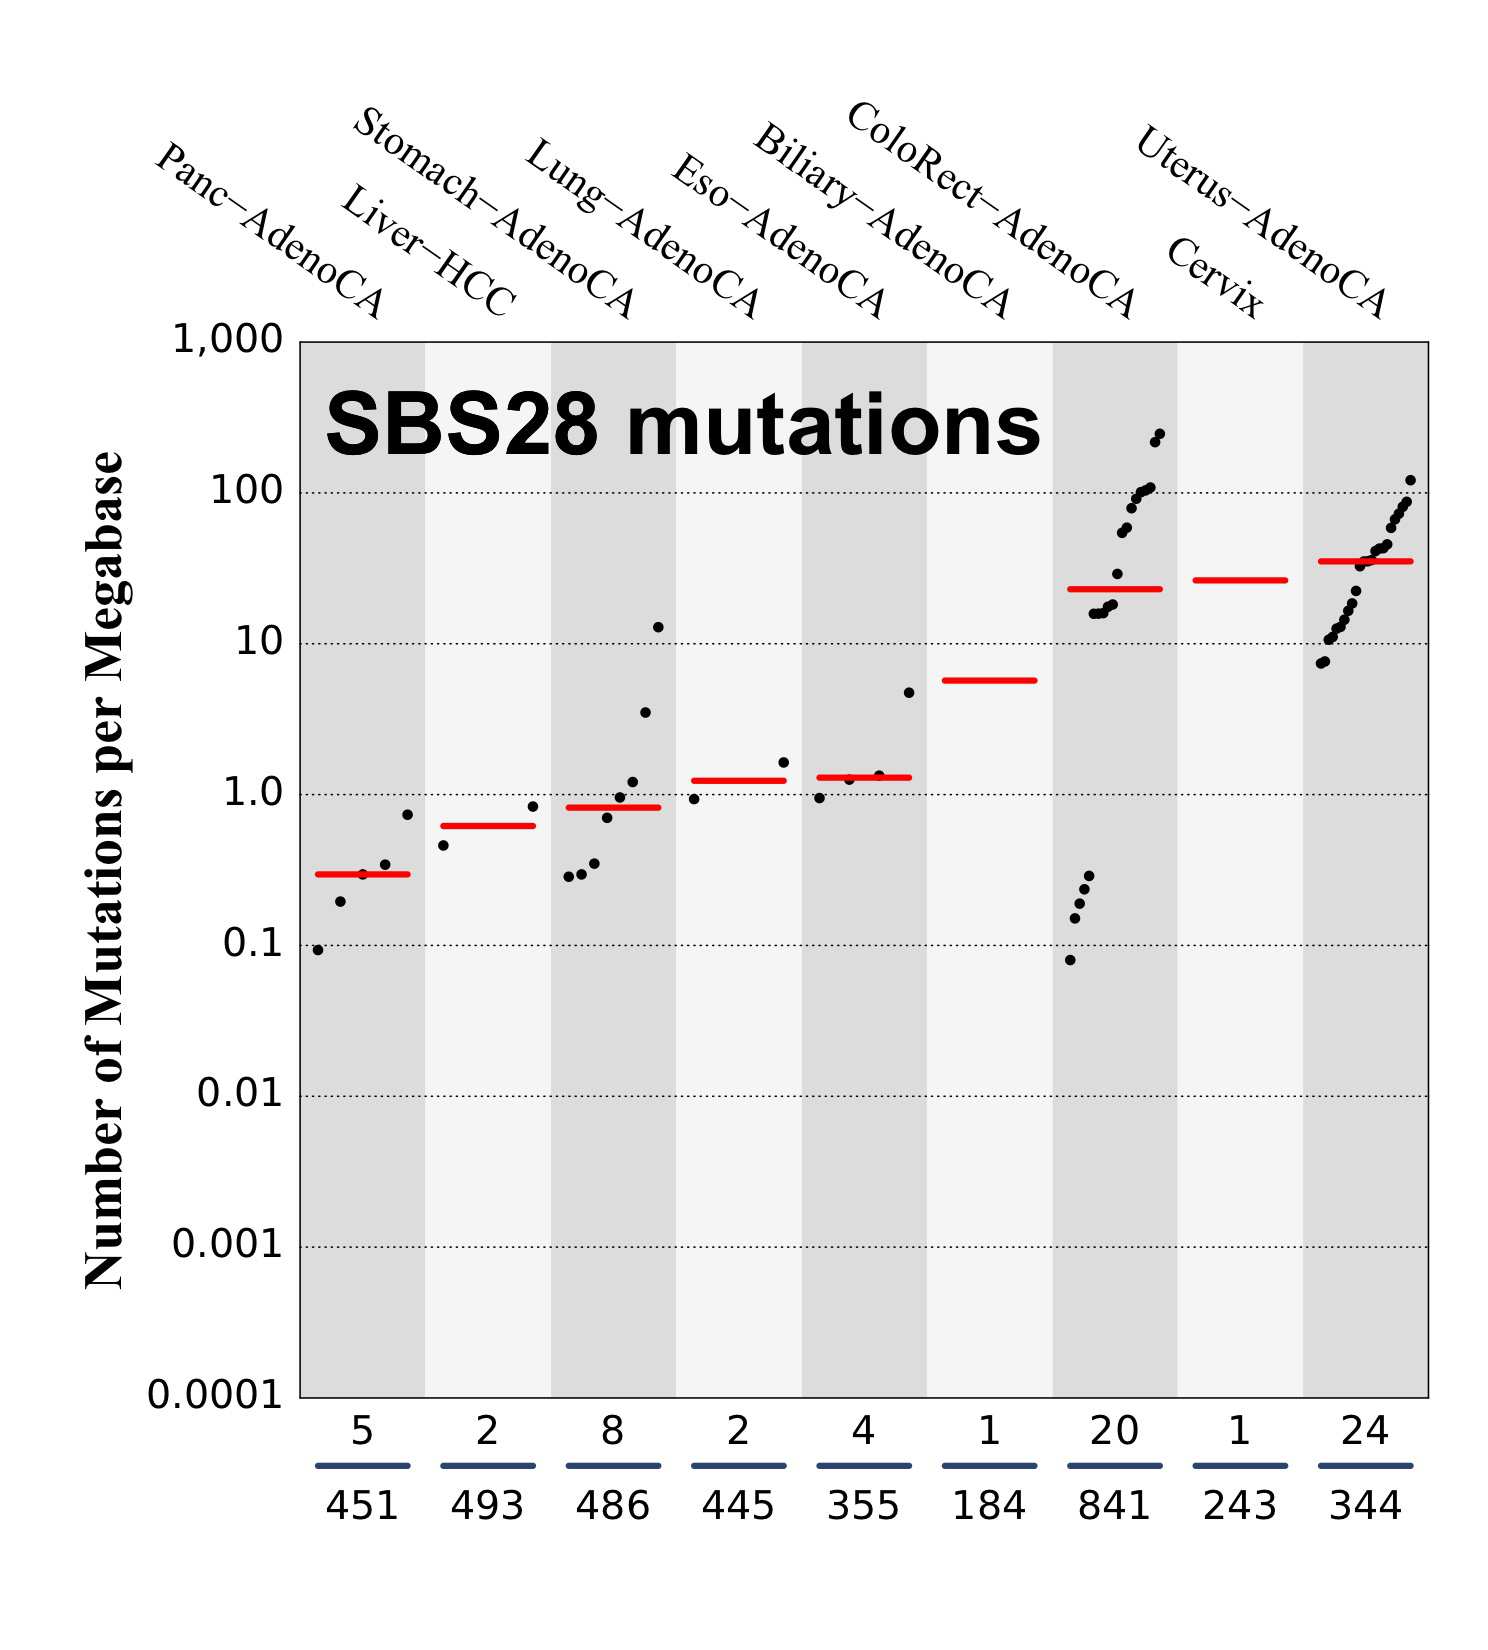
Numbers of mutations per megabase attributed to the mutational signature across the cancer types in which the signature was found. Each dot represents an individual sample and only samples where the signature is found are shown. The number of mutations per megabase was calculated by assuming that an average whole-exome has 30 Mb with sufficient coverage, whereas an average whole-genome has 2,800 Mb with sufficient coverage.
The numbers below the dots for each cancer type indicate the number of high confidence tumours in which at least 10 mutations were attributed to the signature (above the blue horizontal line) and the total number of high confidence tumours analysed (below the blue horizontal line). Only high confidence data are displayed: samples with reconstruction accuracy >0.90. The number of mutations per megabase was calculated by assuming that an average exome has 30 Mb with sufficient coverage, whereas an average whole genome has 2,800 Mb with sufficient coverage.
Associated signatures
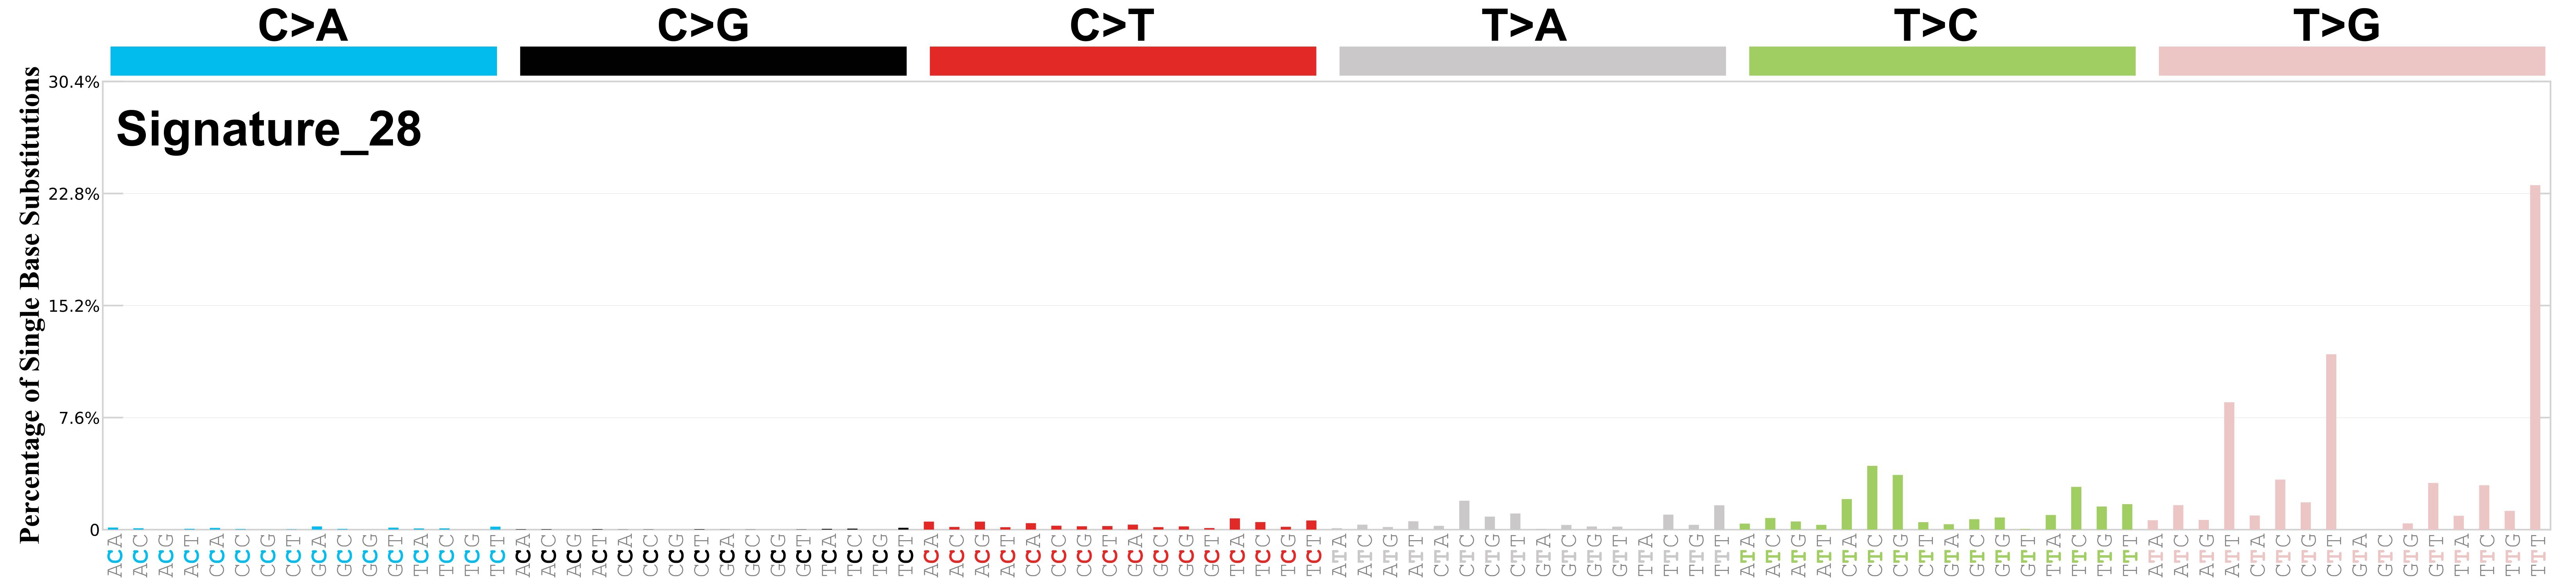
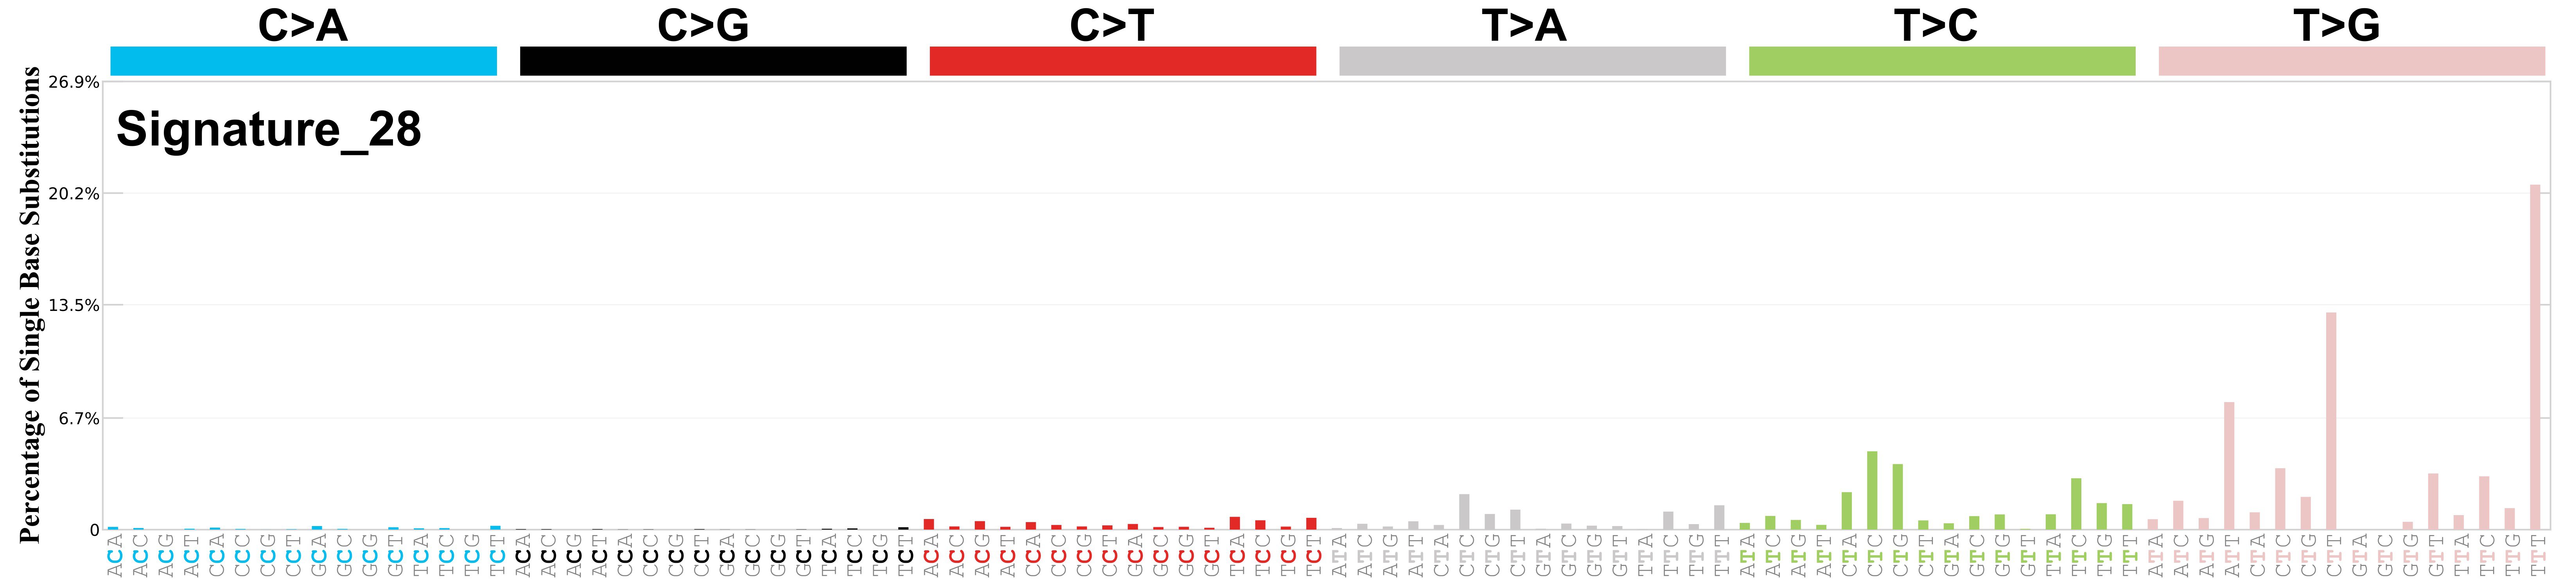
Differences between current and previous profiles

Genome: GRCh37

Genome: GRCh38

Genome: mm9

Genome: mm10

Genome: rn6
The cosine similarity between the prior and current versions of signature SBS28 is 0.92.
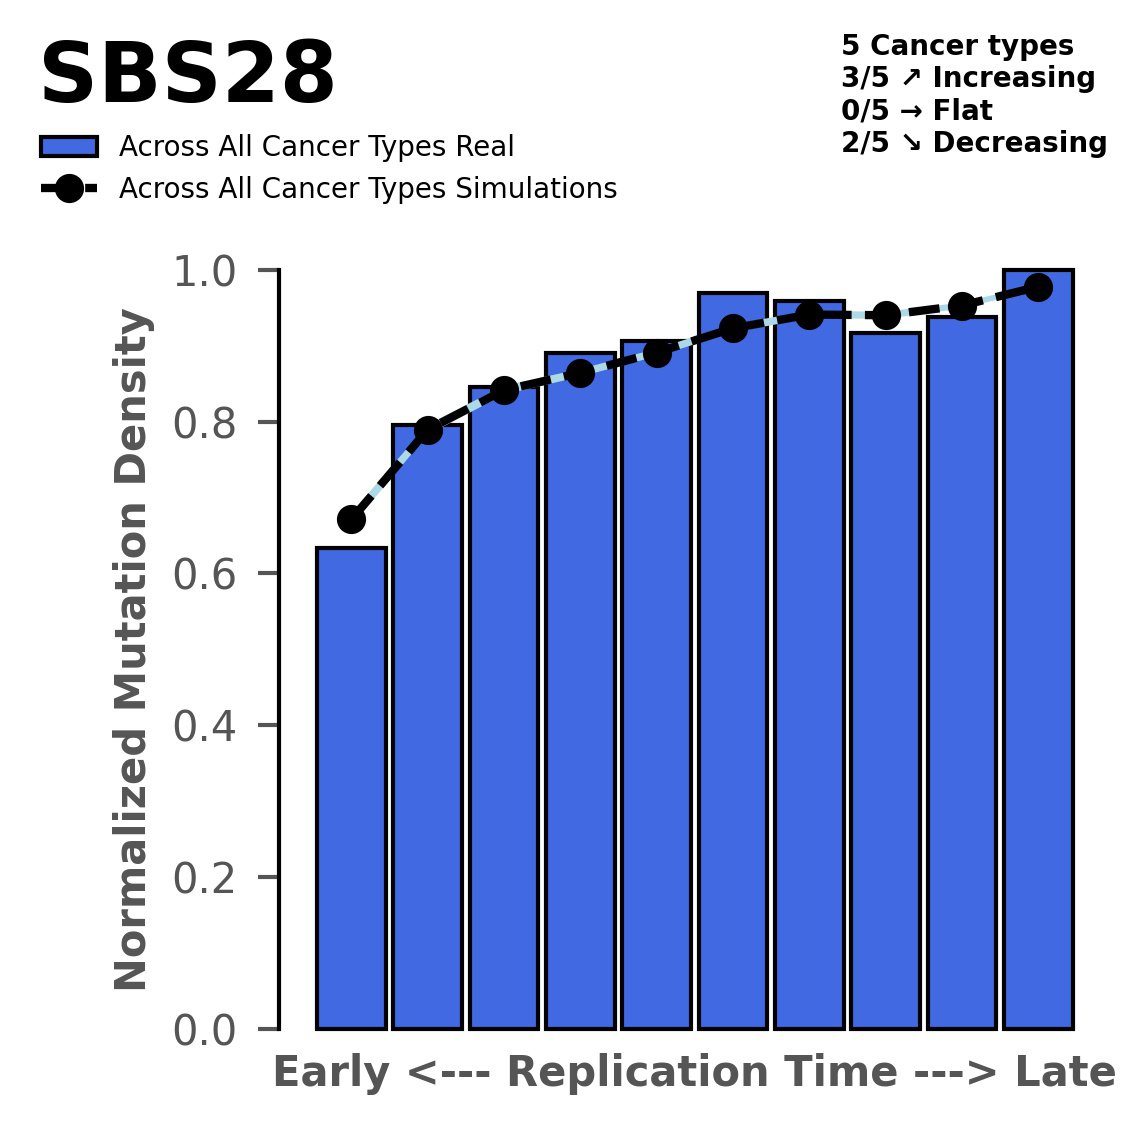
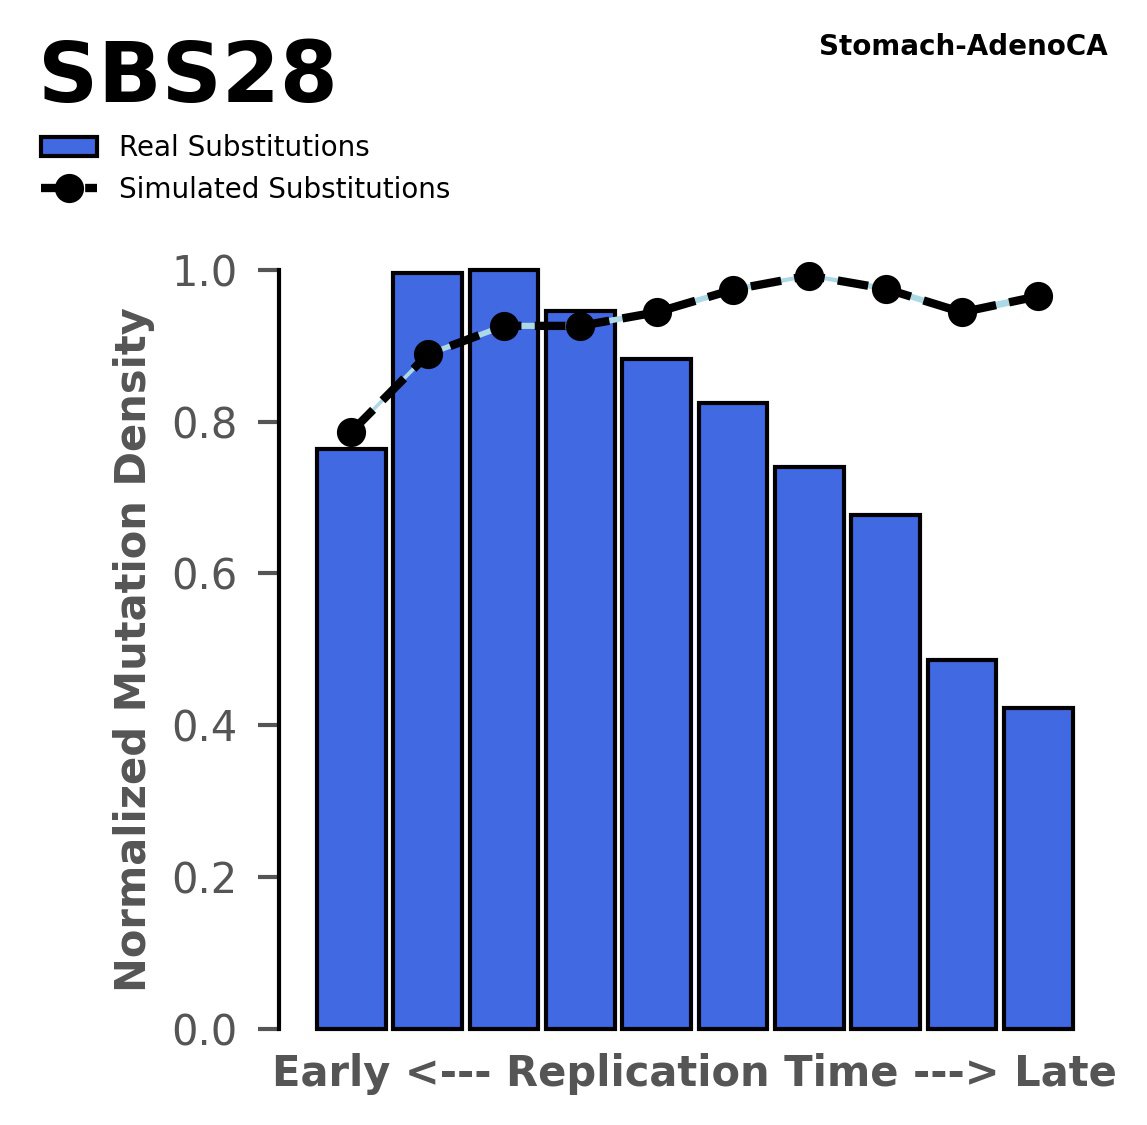
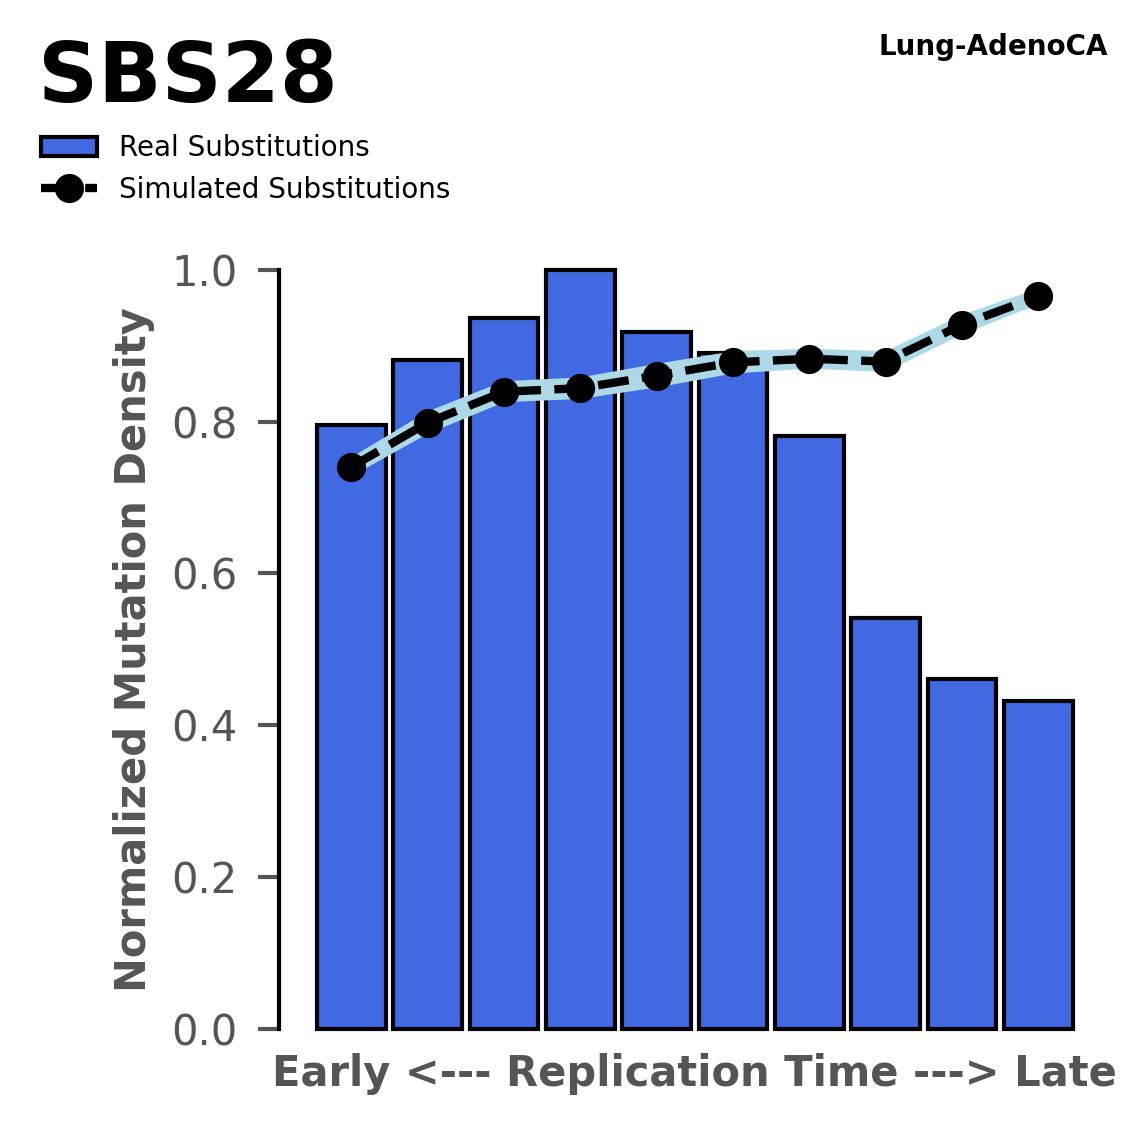
Replication timing

Tissue: aggregated across 5 tissues

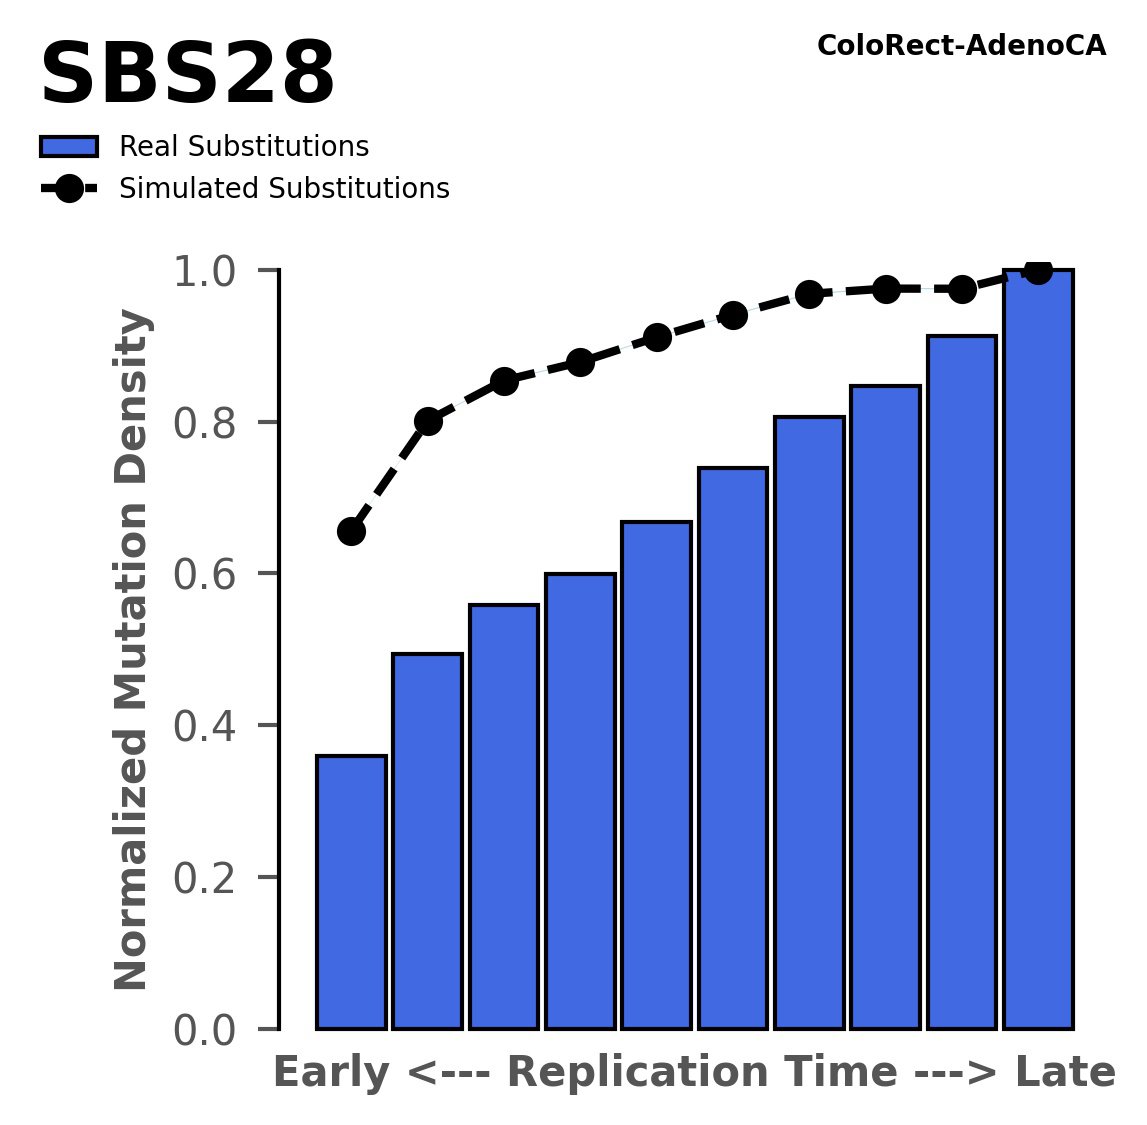
Tissue: ColoRect-AdenoCA (Colorectal Adenocarcinoma)

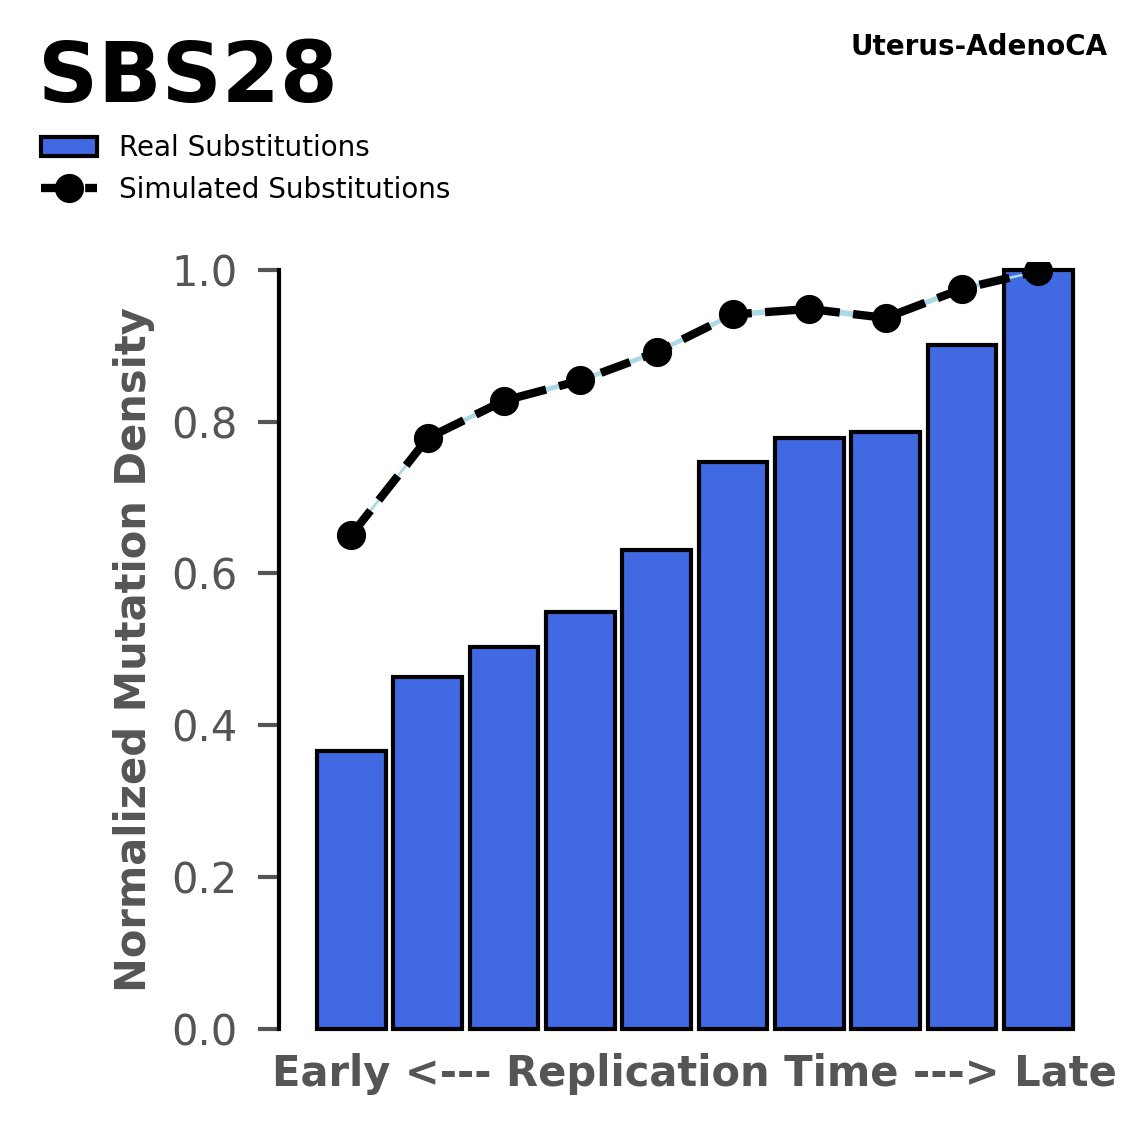
Tissue: Uterus-AdenoCA (Endometrial Adenocarcinoma)

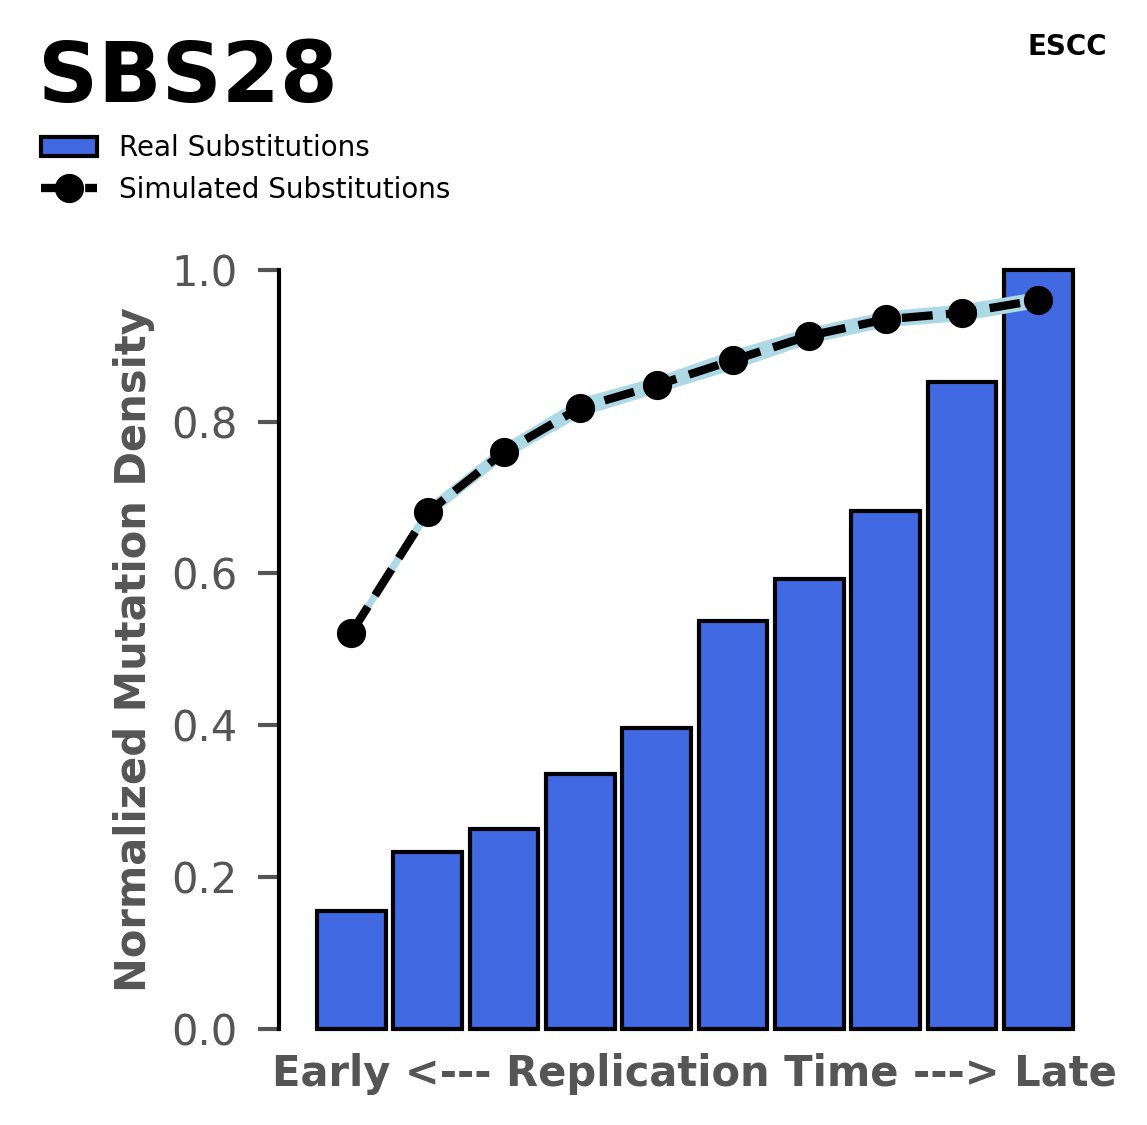
Tissue: ESCC (Esophageal Squamous Cell Carcinoma)

Tissue: Stomach-AdenoCA (Gastric Adenocarcinoma)

Tissue: Lung-AdenoCA (Lung Adenocarcinoma)
Normalised mutational densities from early to late replicating regions in the human genome are shown with respect to real somatic mutations and simulated mutations. The dashed line reflects the behaviour of simulated mutations, whereas the bars represent the behaviour for real somatic mutations.
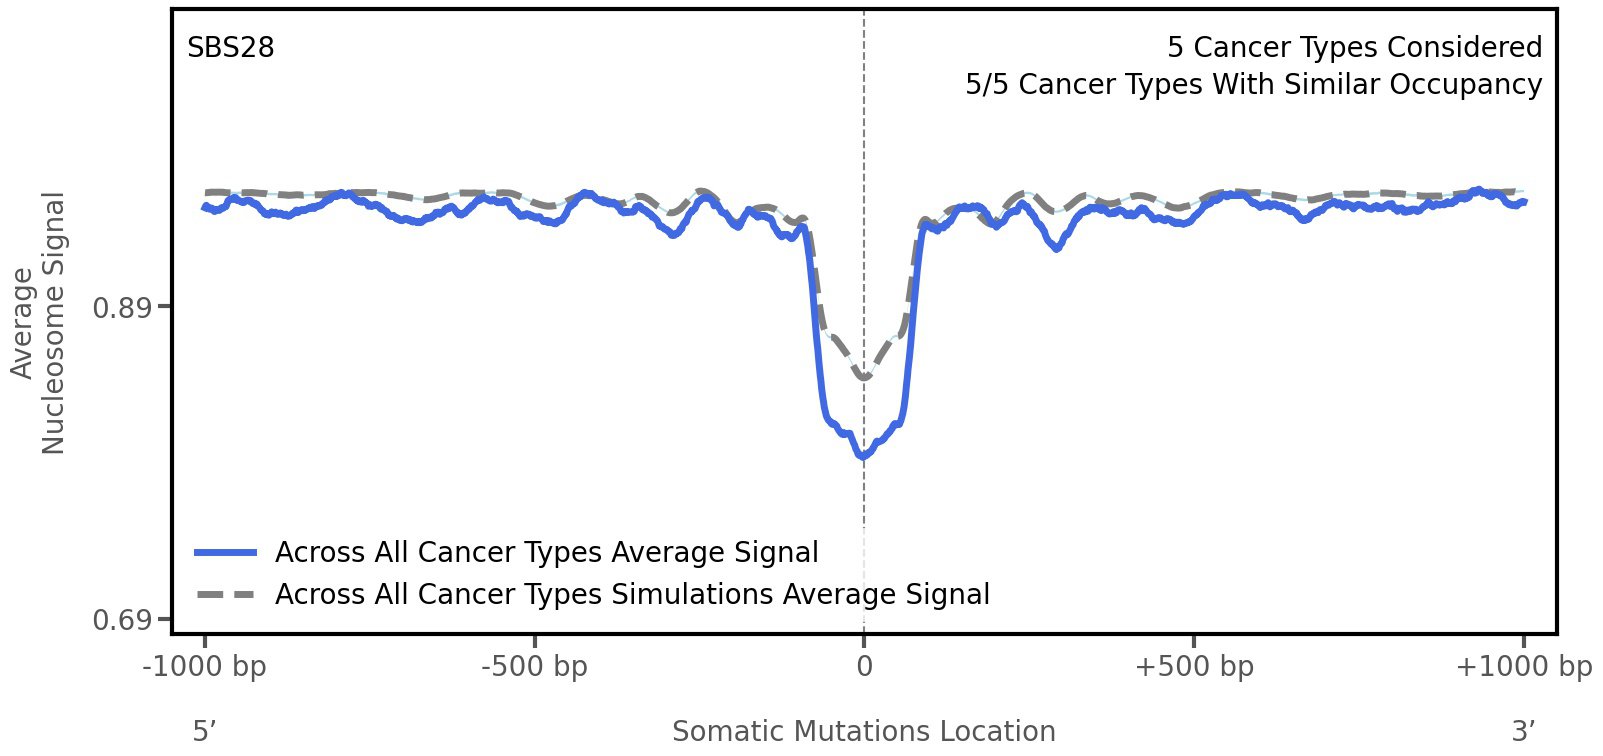
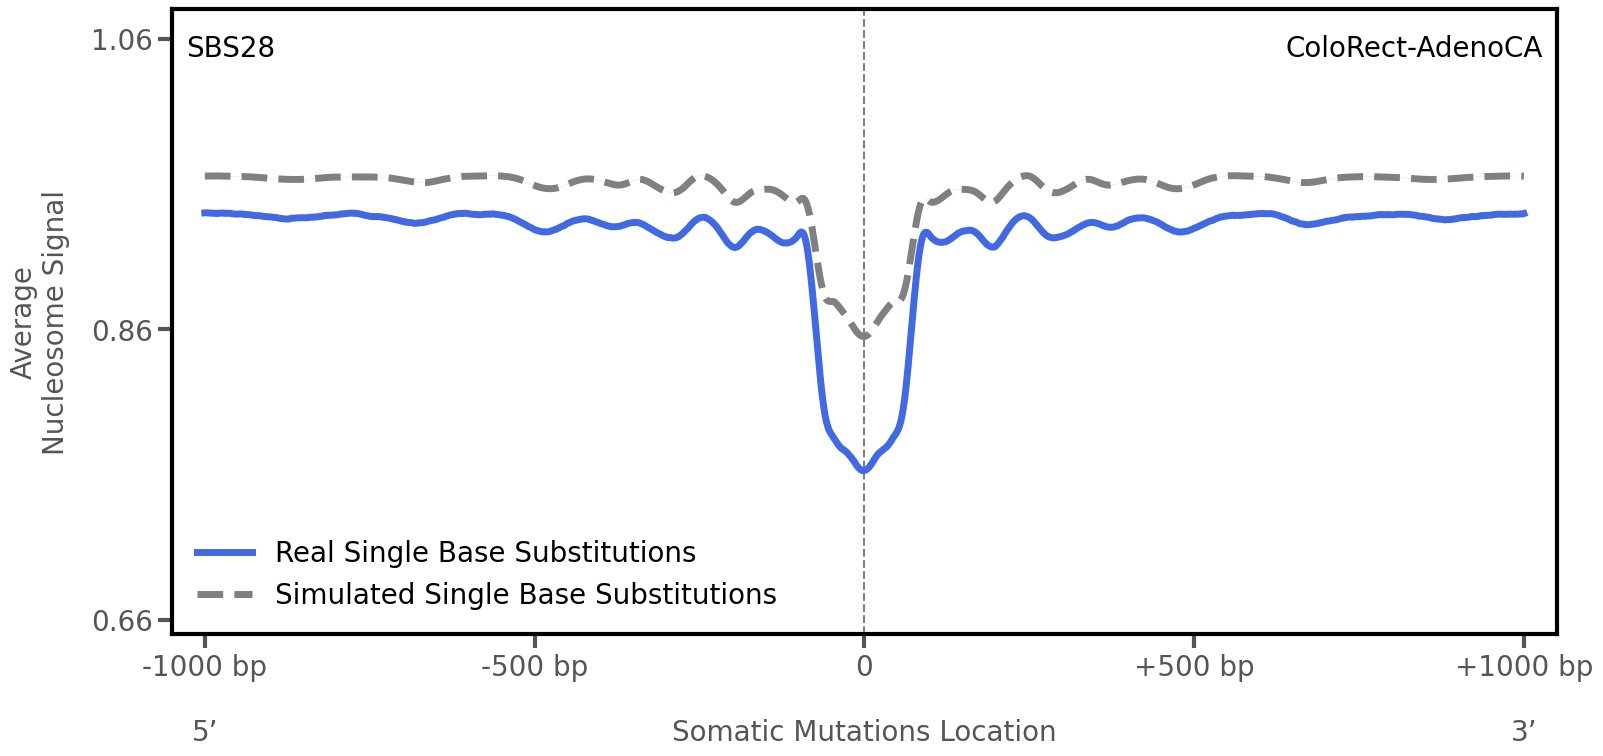
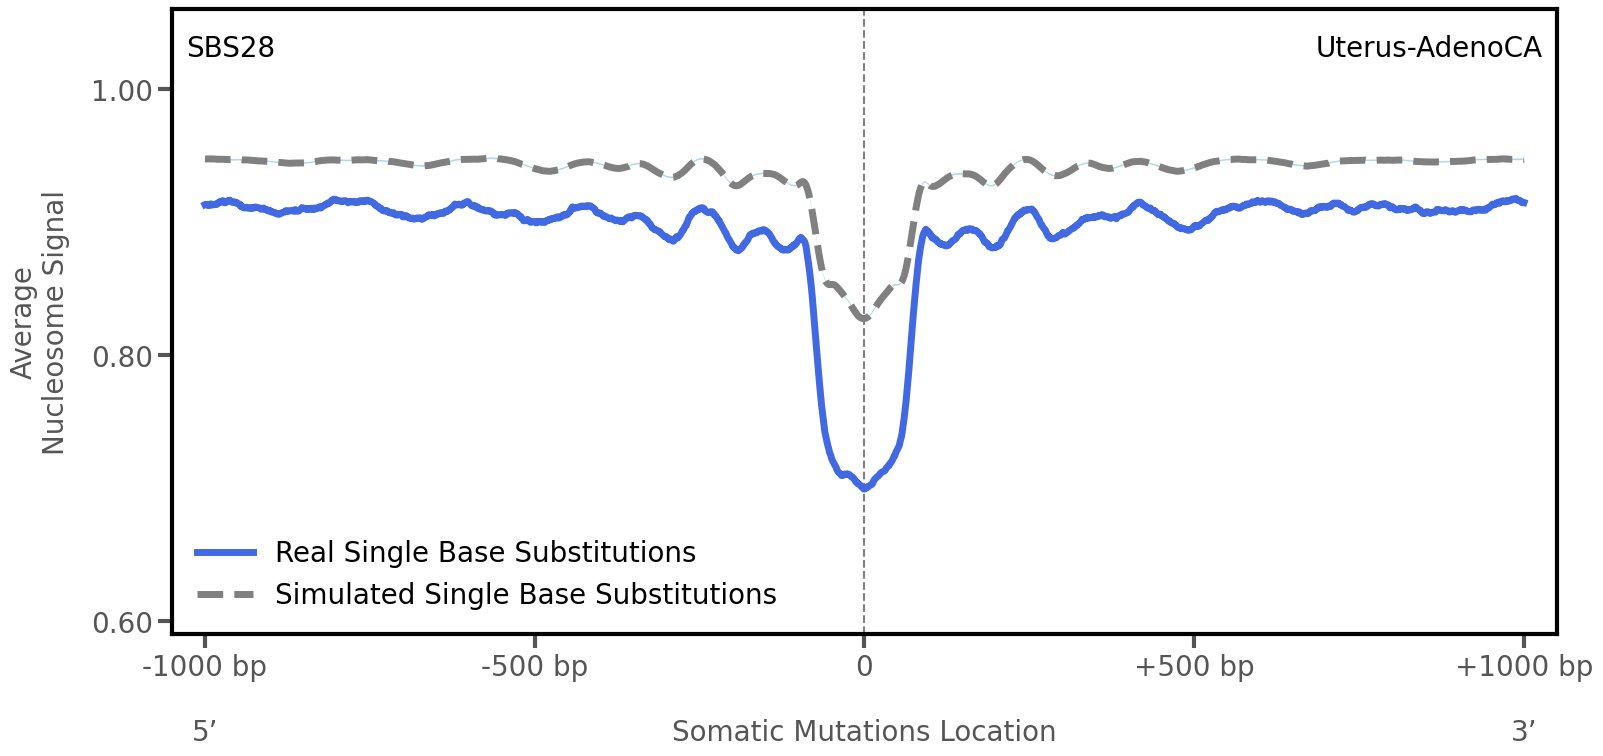
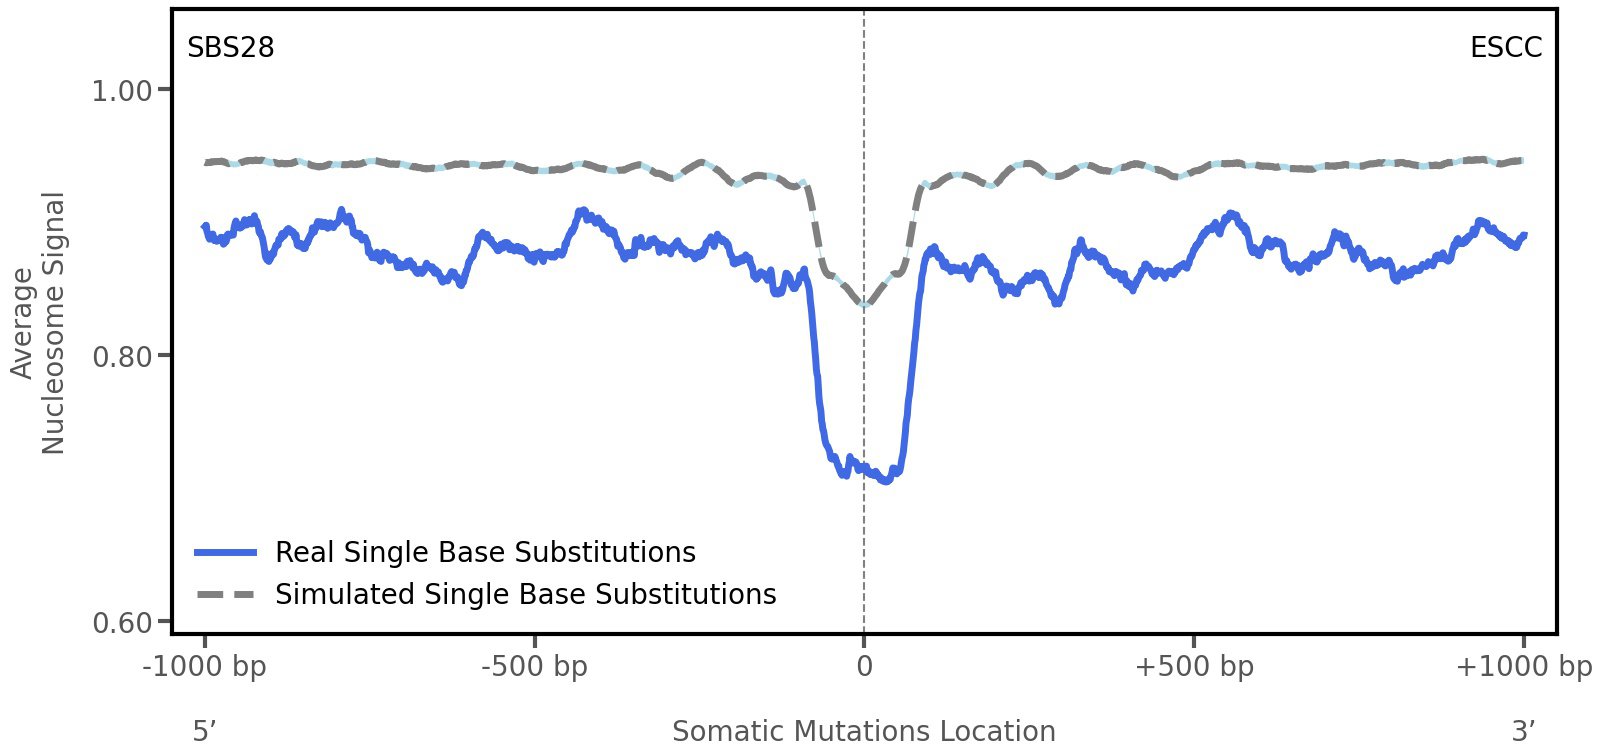
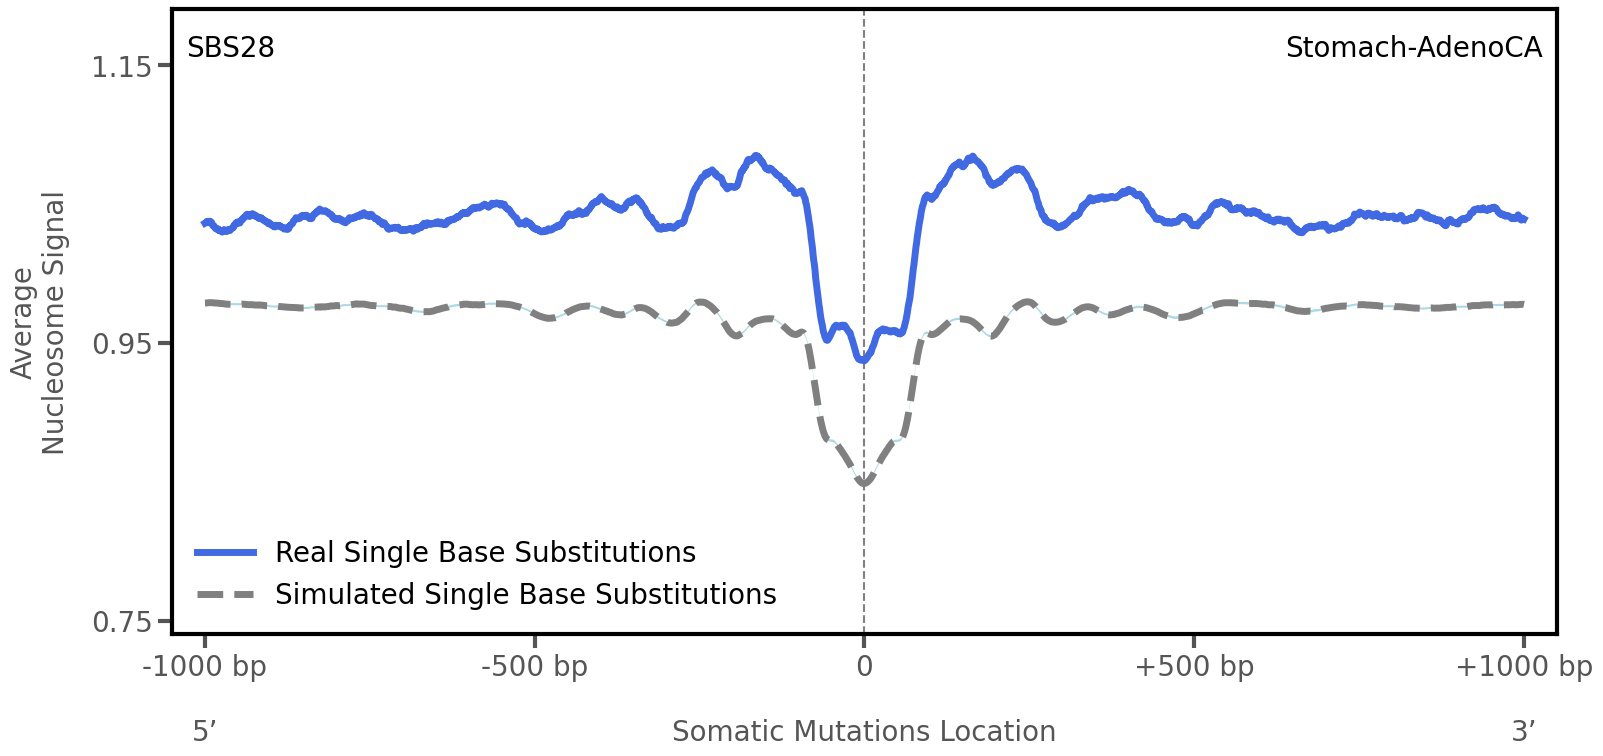
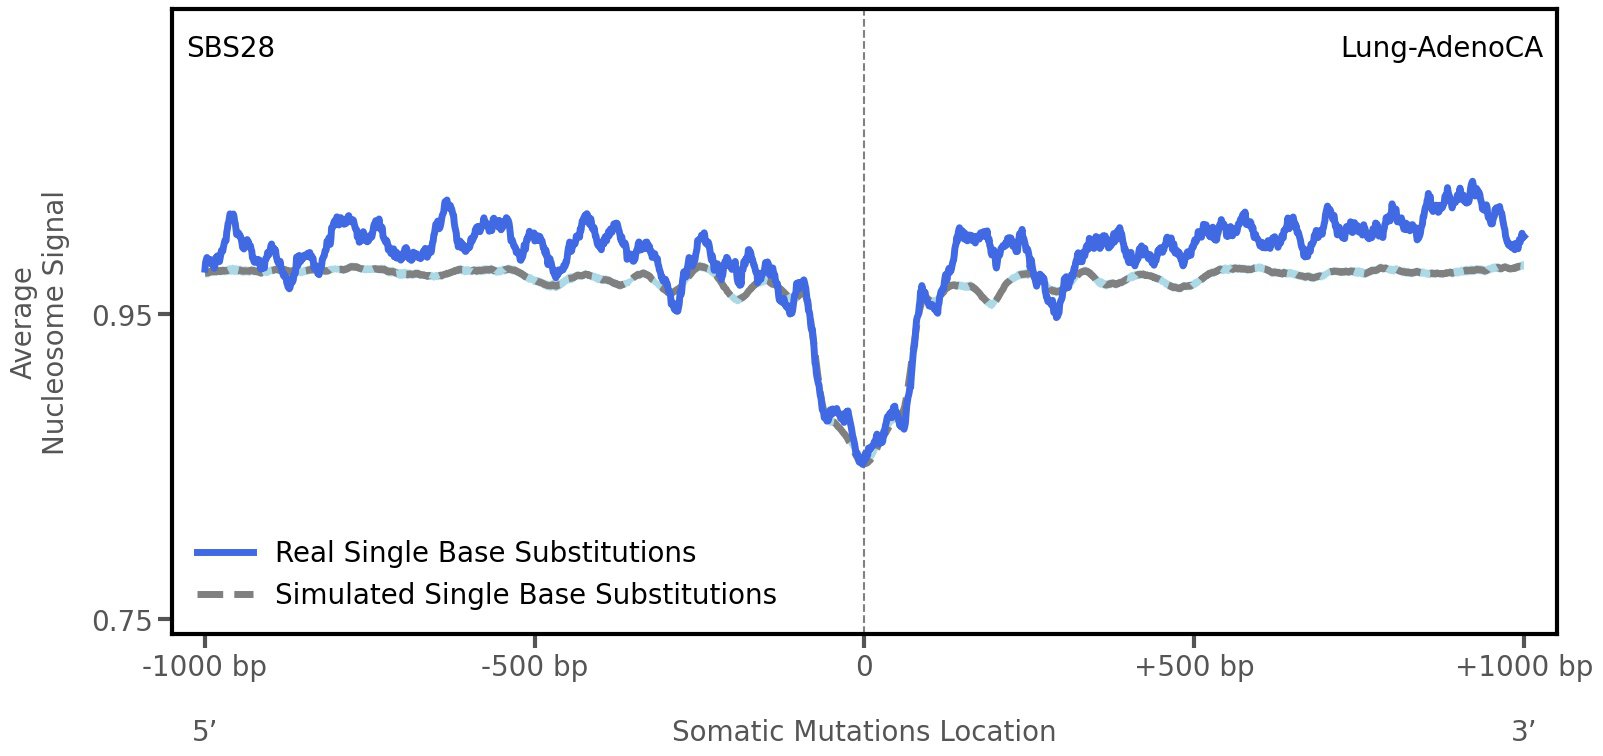
Nucleosome occupancy

Tissue: aggregated across 5 tissues

Tissue: ColoRect-AdenoCA (Colorectal Adenocarcinoma)

Tissue: Uterus-AdenoCA (Endometrial Adenocarcinoma)

Tissue: ESCC (Esophageal Squamous Cell Carcinoma)

Tissue: Stomach-AdenoCA (Gastric Adenocarcinoma)

Tissue: Lung-AdenoCA (Lung Adenocarcinoma)
Average nucleosome signal along a 2 kilobase window centred at the somatic mutation (dashed vertical line). The solid blue line shows the average nucleosome signal for real mutations, whereas the dashed line shows the average nucleosome signal for simulated somatic mutations. A higher signal reflects a higher propensity for nucleosome occupancy.
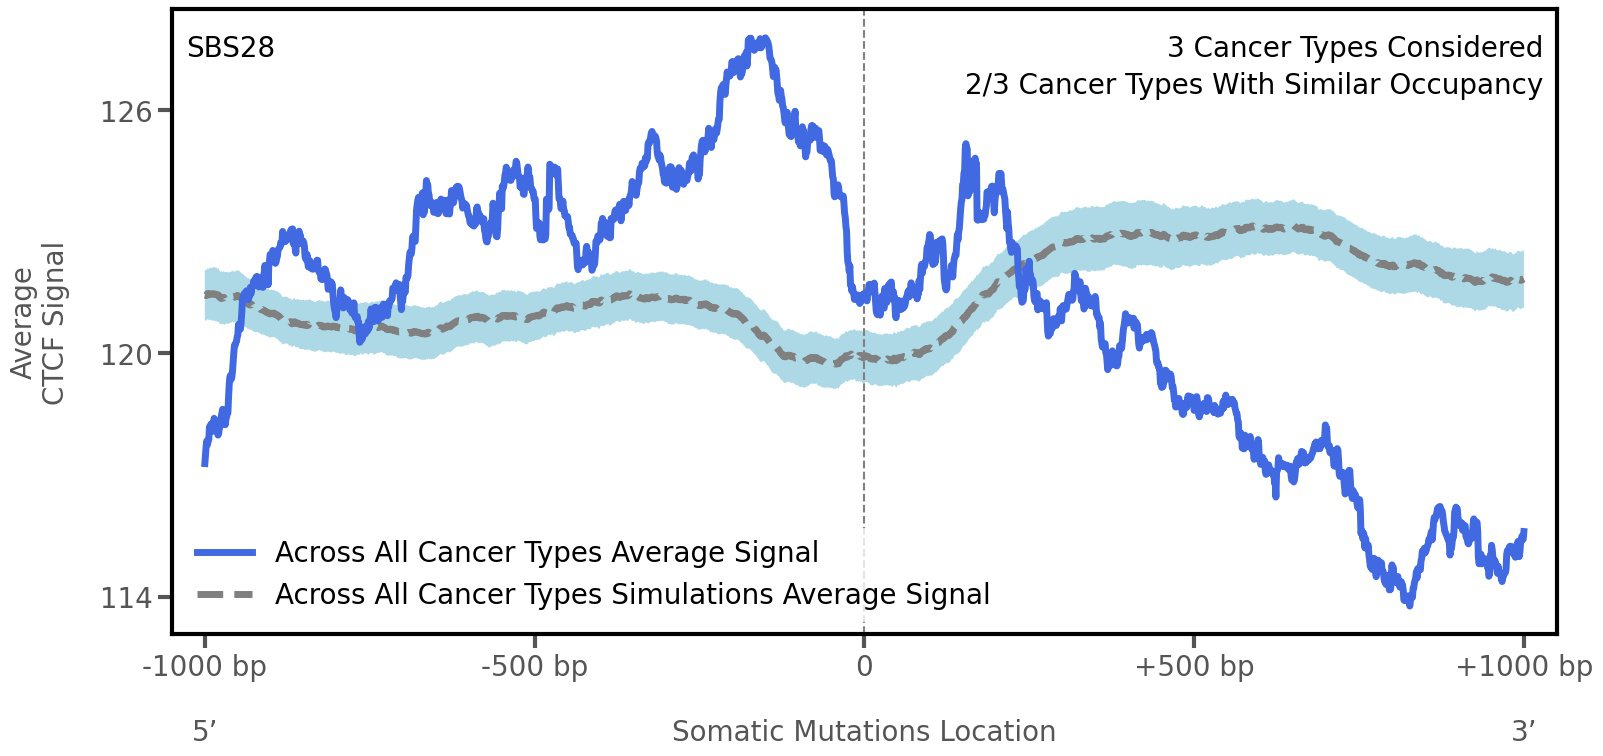
CTCF occupancy

Tissue: aggregated across 3 tissues

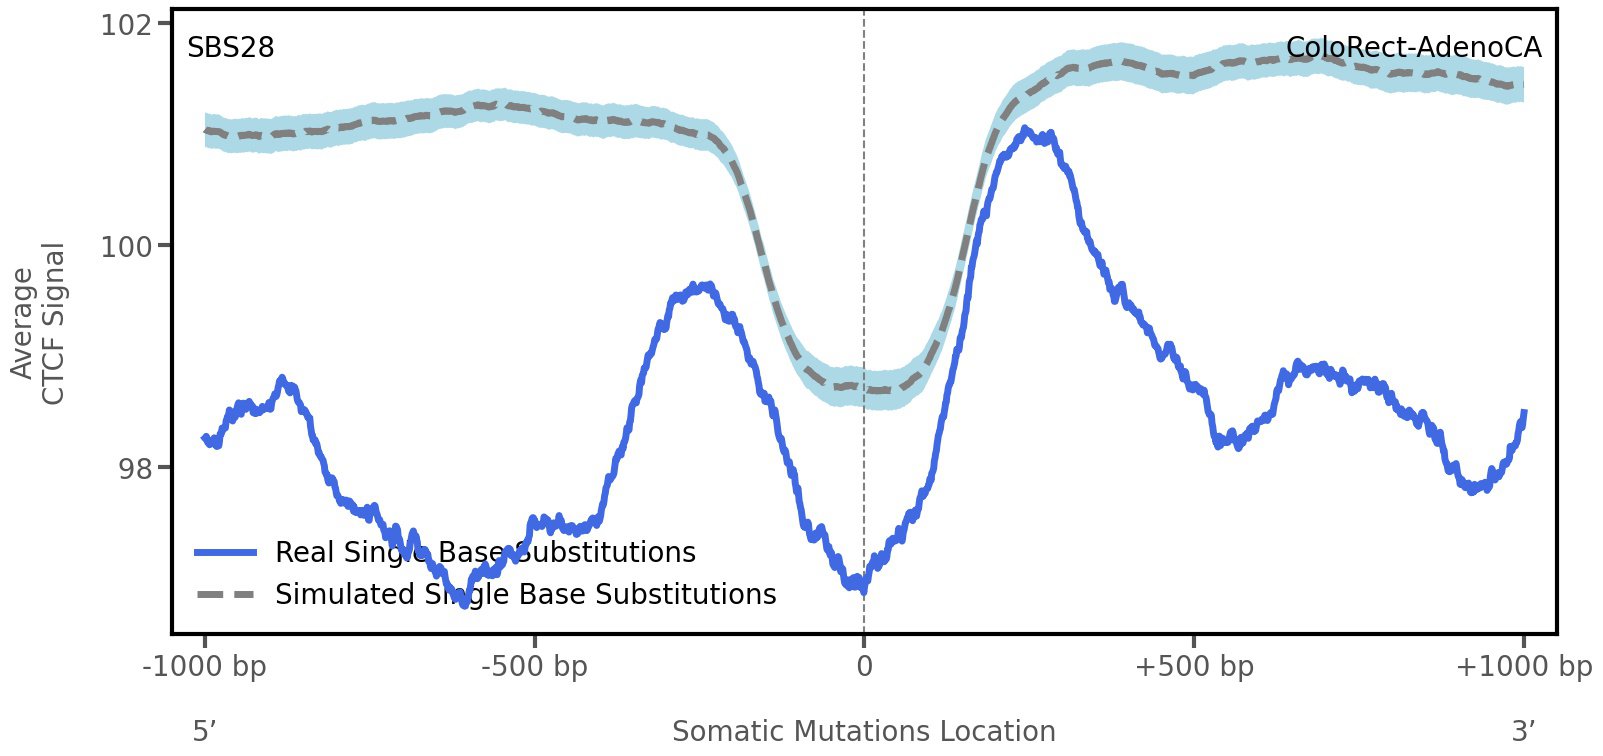
Tissue: ColoRect-AdenoCA (Colorectal Adenocarcinoma)

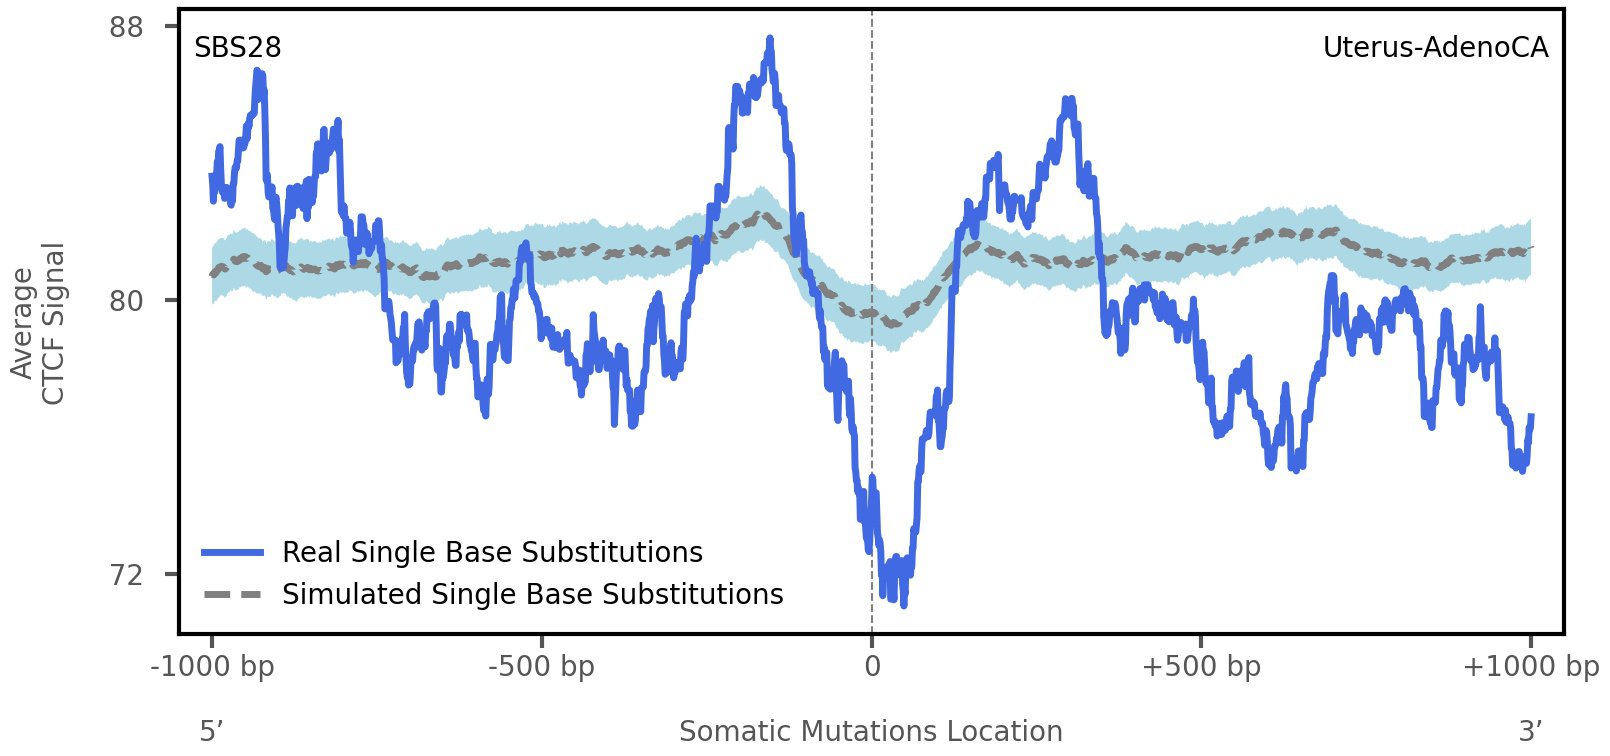
Tissue: Uterus-AdenoCA (Endometrial Adenocarcinoma)

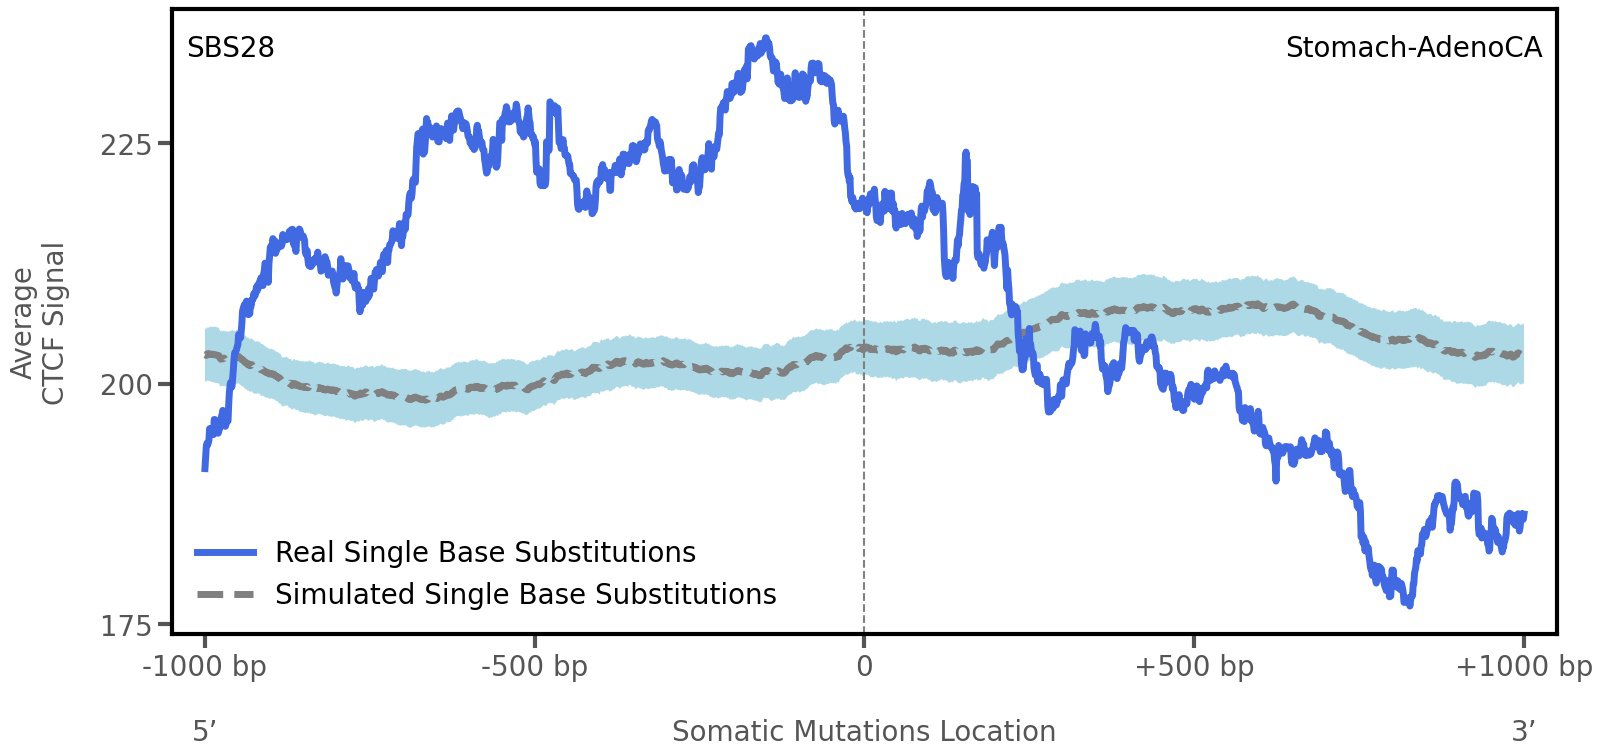
Tissue: Stomach-AdenoCA (Gastric Adenocarcinoma)
CCCTC-binding factor (CTCF) is a multi-functional, sequence-specific transcription factor encoded by the CTCF gene. It can function as a transcriptional activator, a repressor, or an insulator protein by blocking the communication between enhancers and promoters.
This plot shows the average CTCF signal along a 2 kilobase window centered at the somatic mutation (dashed vertical line). The blue solid line shows the average CTCF signal for real mutations, whereas the dashed line shows the average CTCF signal for simulated mutations. A higher signal reflects a higher propensity for CTCF binding.
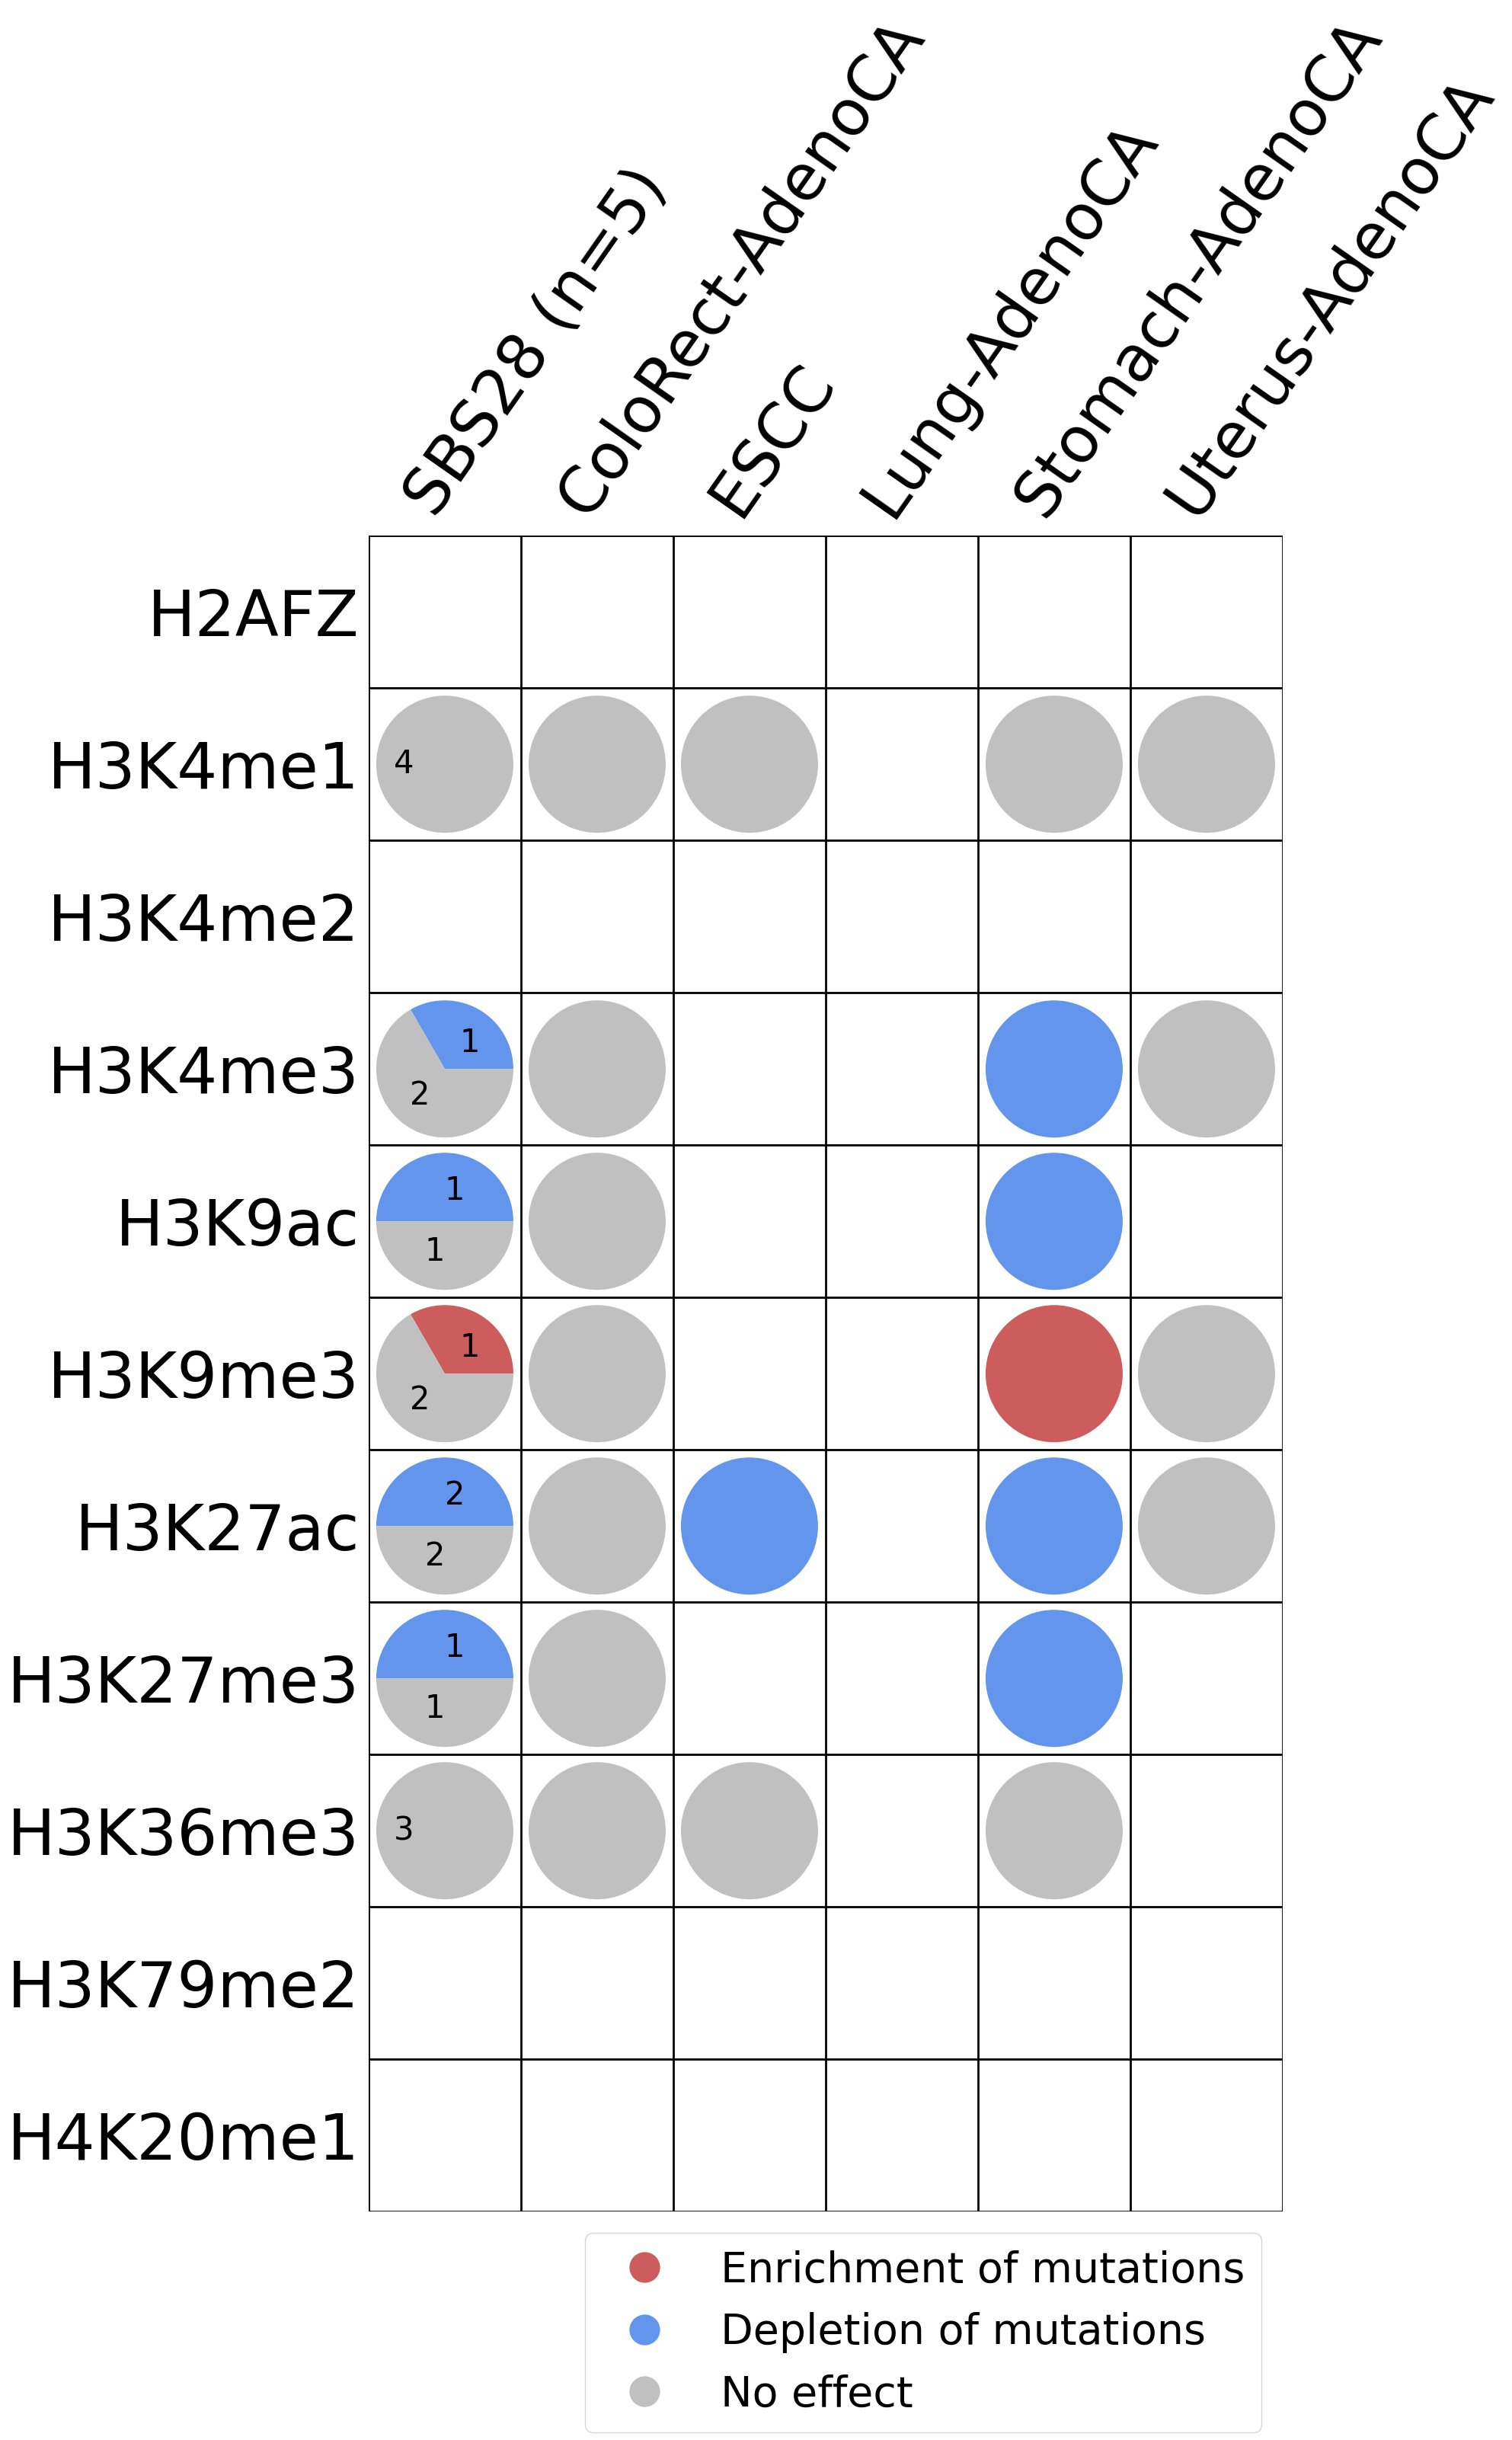
Histone modifications

This plot shows the associations between mutational signatures and histone marks. Pie charts display the number of cancer types that are either enriched, depleted, or have no statistical effect for a given mutational signature and a specific histone mark. Differential changes are calculated by statistically comparing the of average signals between real and simulated mutations using a 100 base window centered at the somatic mutation. Enrichments reflect at least 5% statistically significant increases in real signal when compared to simulated signal. Depletions reflect at least 5% statistically significant decreases in real signal when compared to simulated signal. Statistical significance is determined based on false-discovery rate corrected p-value below 0.05.
(i) H2AFZ, a replication-independent member of the histone H2A family that renders chromatin accessible at enhancers and promoters and regulates transcriptional activation and repression; (ii) H3K4me1, histone mark often associated with enhancer activity; (iii) H3K4me2, a histone post-translational modification enriched in cis-regulatory regions, including both enhancers and promoters; (iv) H3K4me3, post-translational modification enriched in active promoters near transcription start sites; (v) H3K9ac, associated with active gene promoters and active transcription; (vi) H3K9me3, typical mark of constitutive heterochromatin; (vii) H3K27ac, histone modification generally contained at nucleosomes flanking enhancers; (viii) H3K27me3, repressive, associated with silent genes; (ix) H3K36me3, associated with transcribed regions and playing a role in regulating DNA damage repair; (x) H3K79me2, detected in the transcribed regions of active genes; and (xi) H4K20me1, found in gene promoters and associated with gene transcriptional elongation and transcription activation.
Transcriptional strand asymmetry
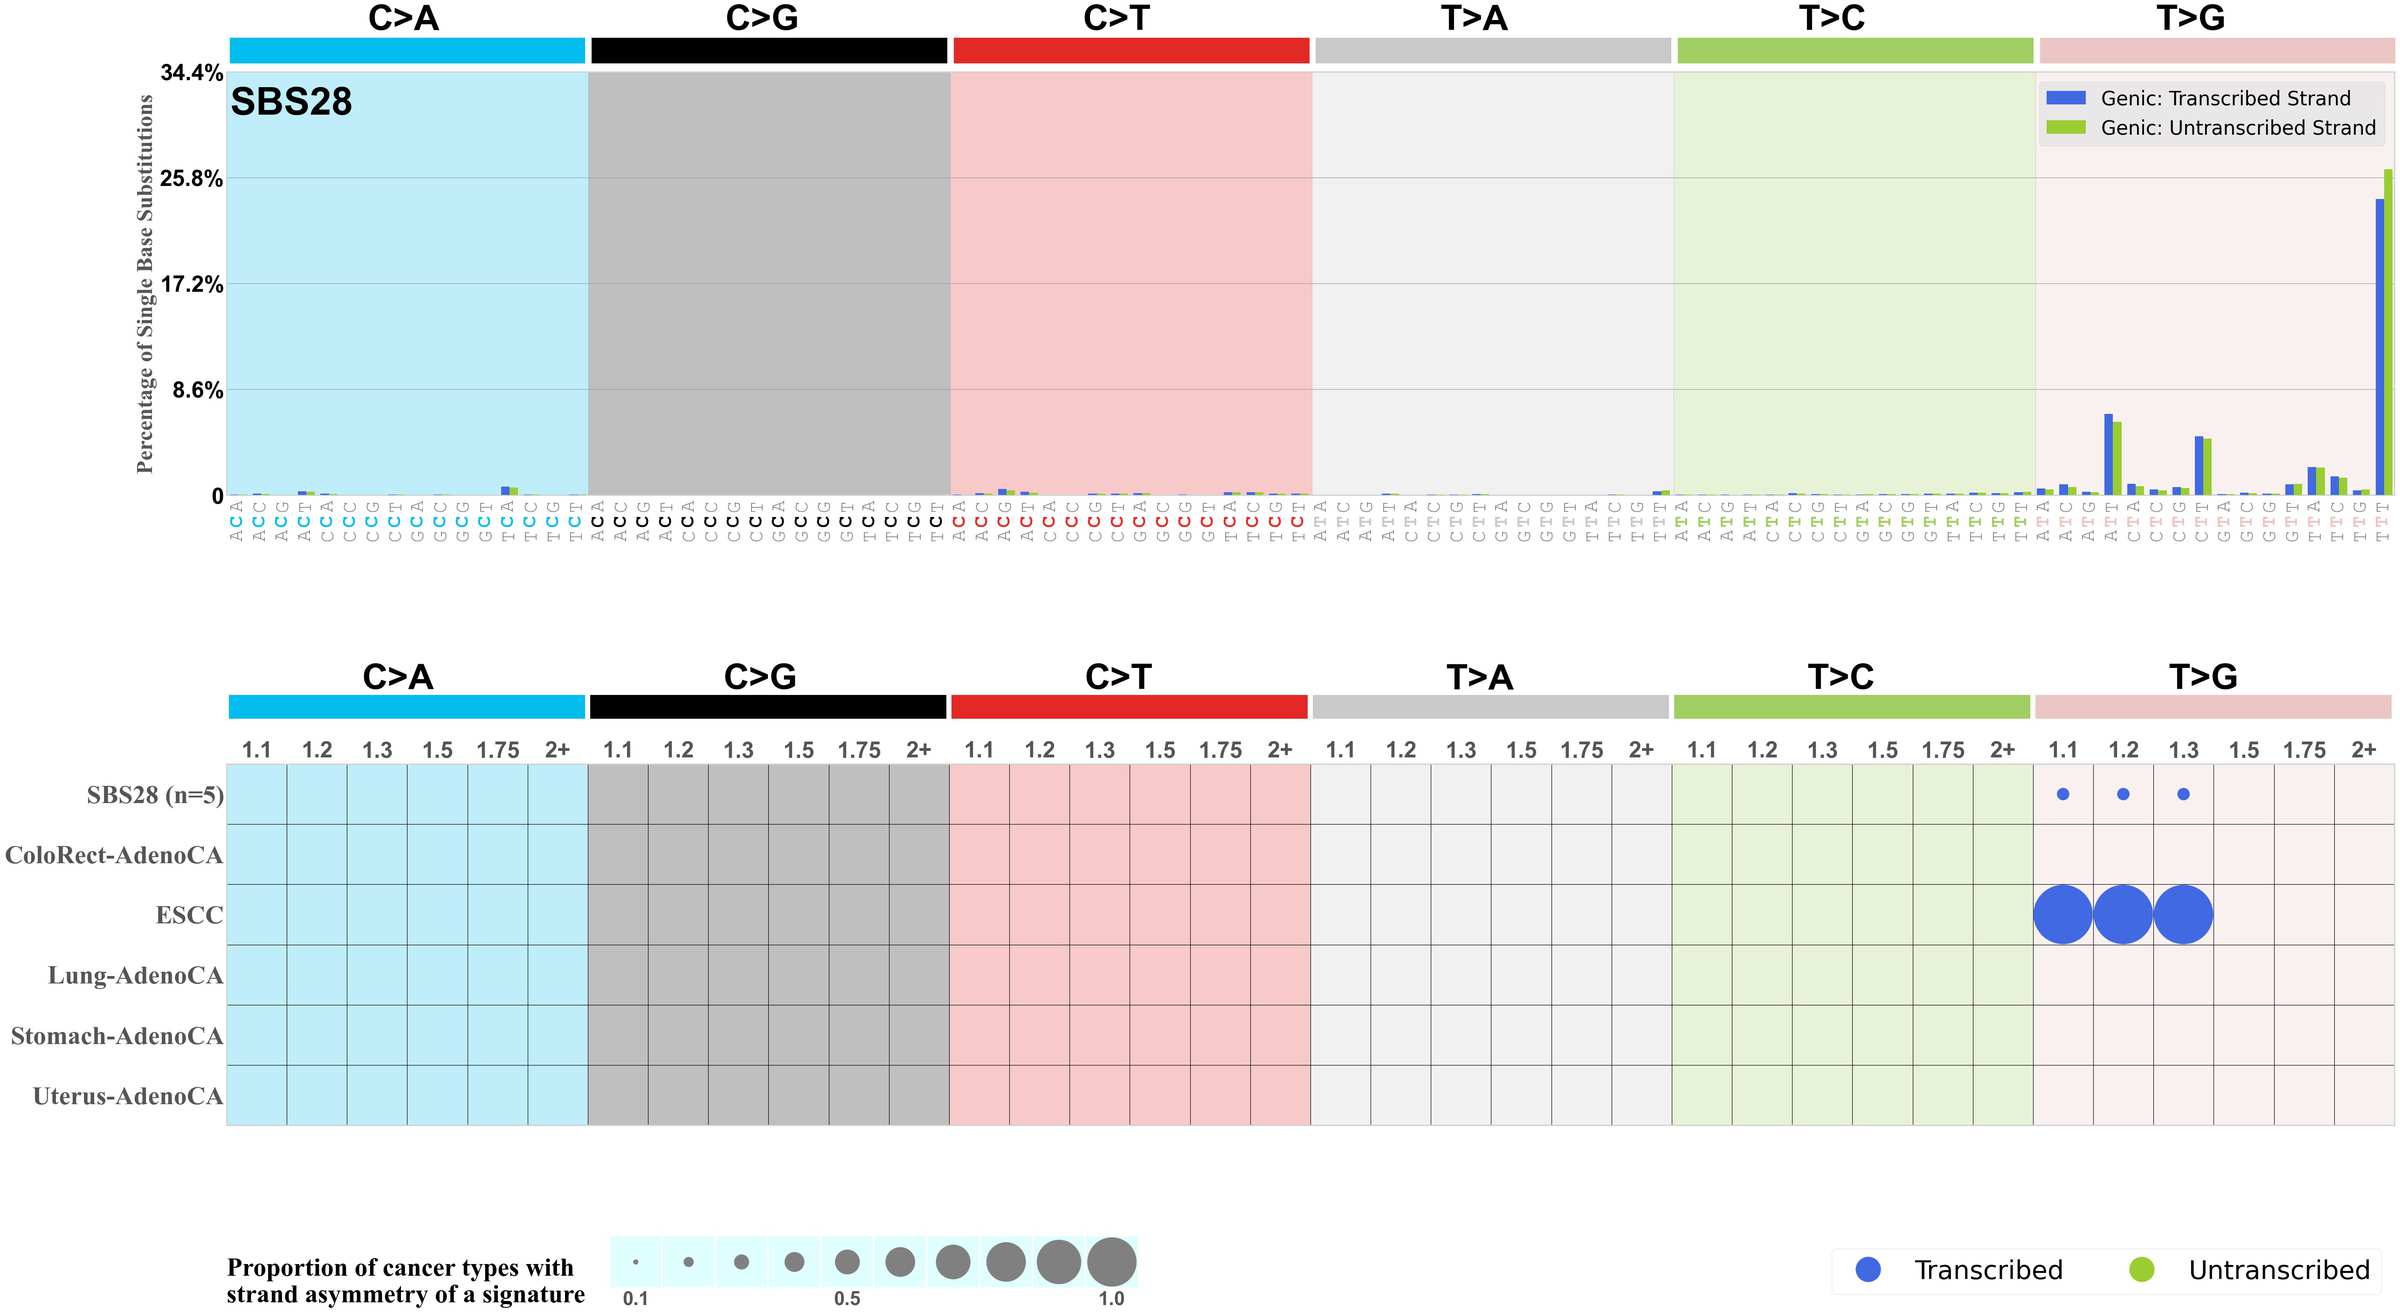
Mutational signatures exhibit asymmetric number of mutations due to either one of the DNA strands being preferentially repaired or one of the DNA strands having a higher propensity for being damaged. One common example of strand asymmetry is transcription-strand asymmetry which can be due to the activity of transcription-coupled nucleotide excision repair (TC-NER) or transcription-coupled damage amongst others.
The upper bar plot represents the percentage of real mutations in transcribed and untranscribed strands averaged across the human genome as well as all examined samples in 96 mutational context.
In the lower circle plot, the circles are filled with the colour of the significant strand when there is an odds ratio of at least 1.1 with statistical significance. The first row of this plot displays the transcriptional strand asymmetry across all cancer types, while the remaining rows present transcriptional strand asymmetry for each cancer type.
Each mutation attributed to the mutational signature is annotated as either on the transcribed strand, untranscribed strand, or non-transcribed strand.
The odds ratio is defined as the real mutations ratio divided by the simulated mutations ratio, where each ratio is calculated using the number of mutations on transcribed and untranscribed strands. And the number of real mutations on transcribed and untranscribed strands must be statistically significant with respect to the average number of simulated mutations on transcribed and untranscribed strands.
The strand with the higher number of real mutations defines the numerator of both the real mutations ratio and the simulated mutations ratio.
The strand with the lower number of real mutations defines the denominator of both the real mutations ratio and the simulated mutations ratio.
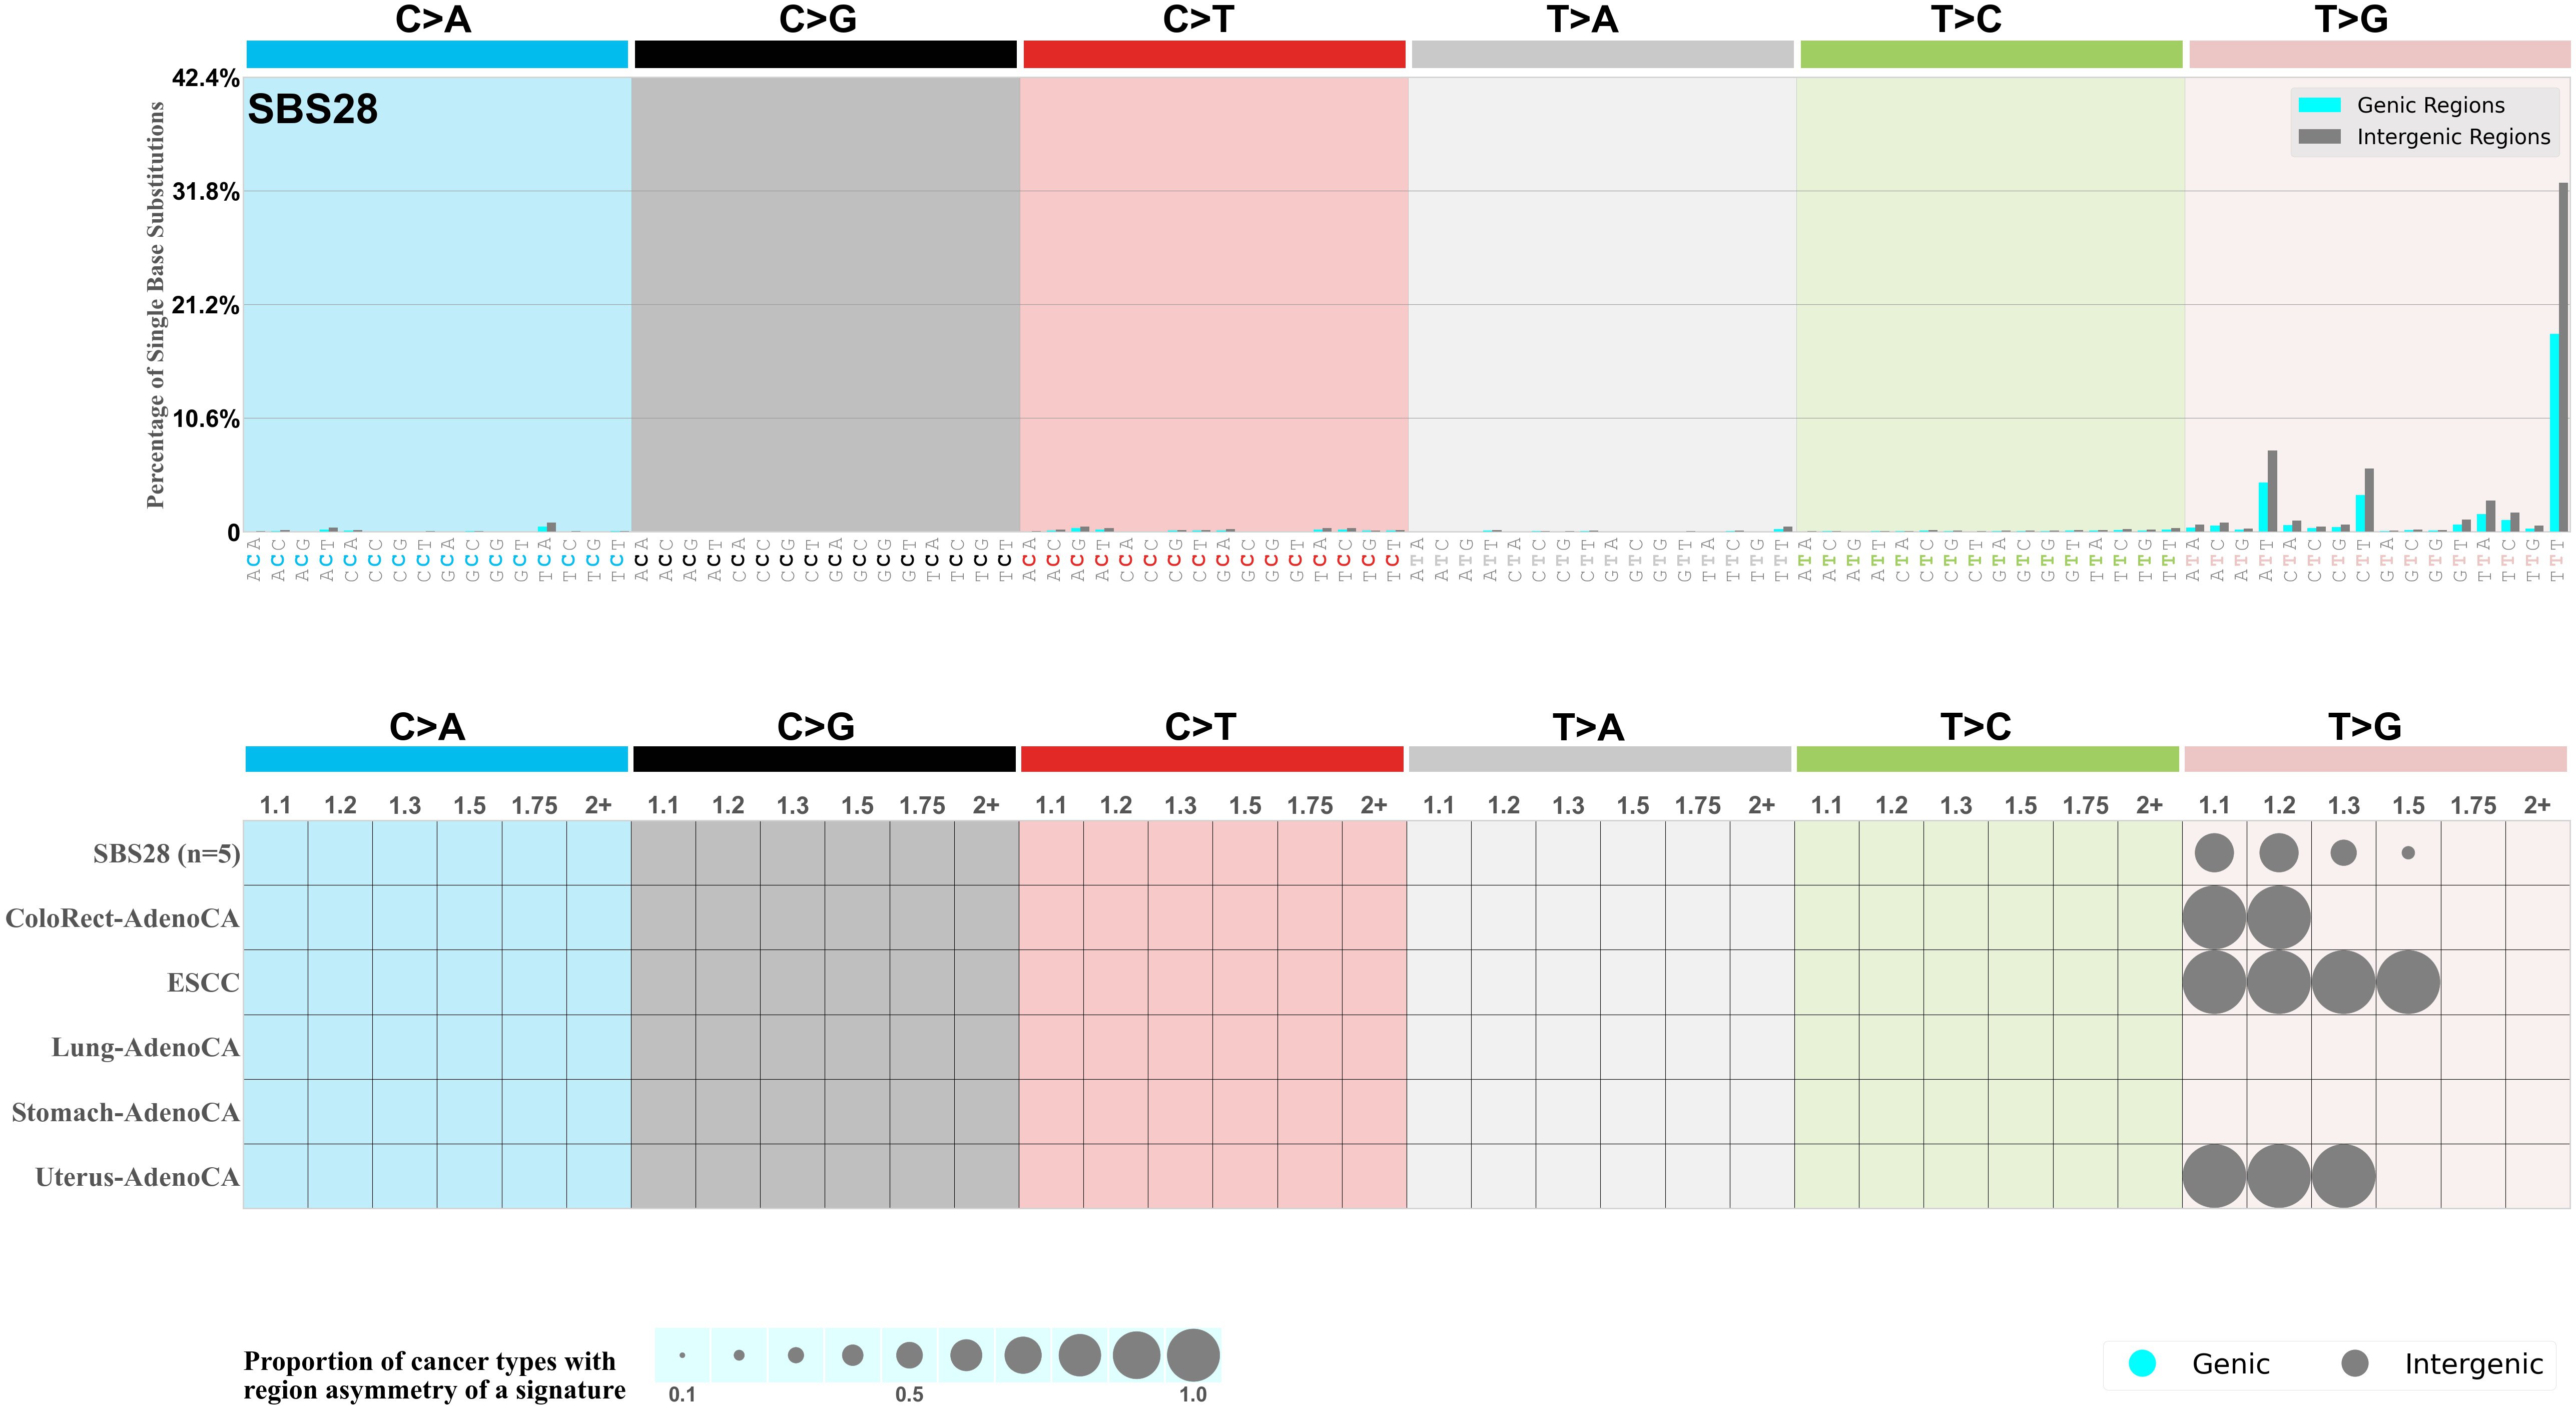
Genic and intergenic regions
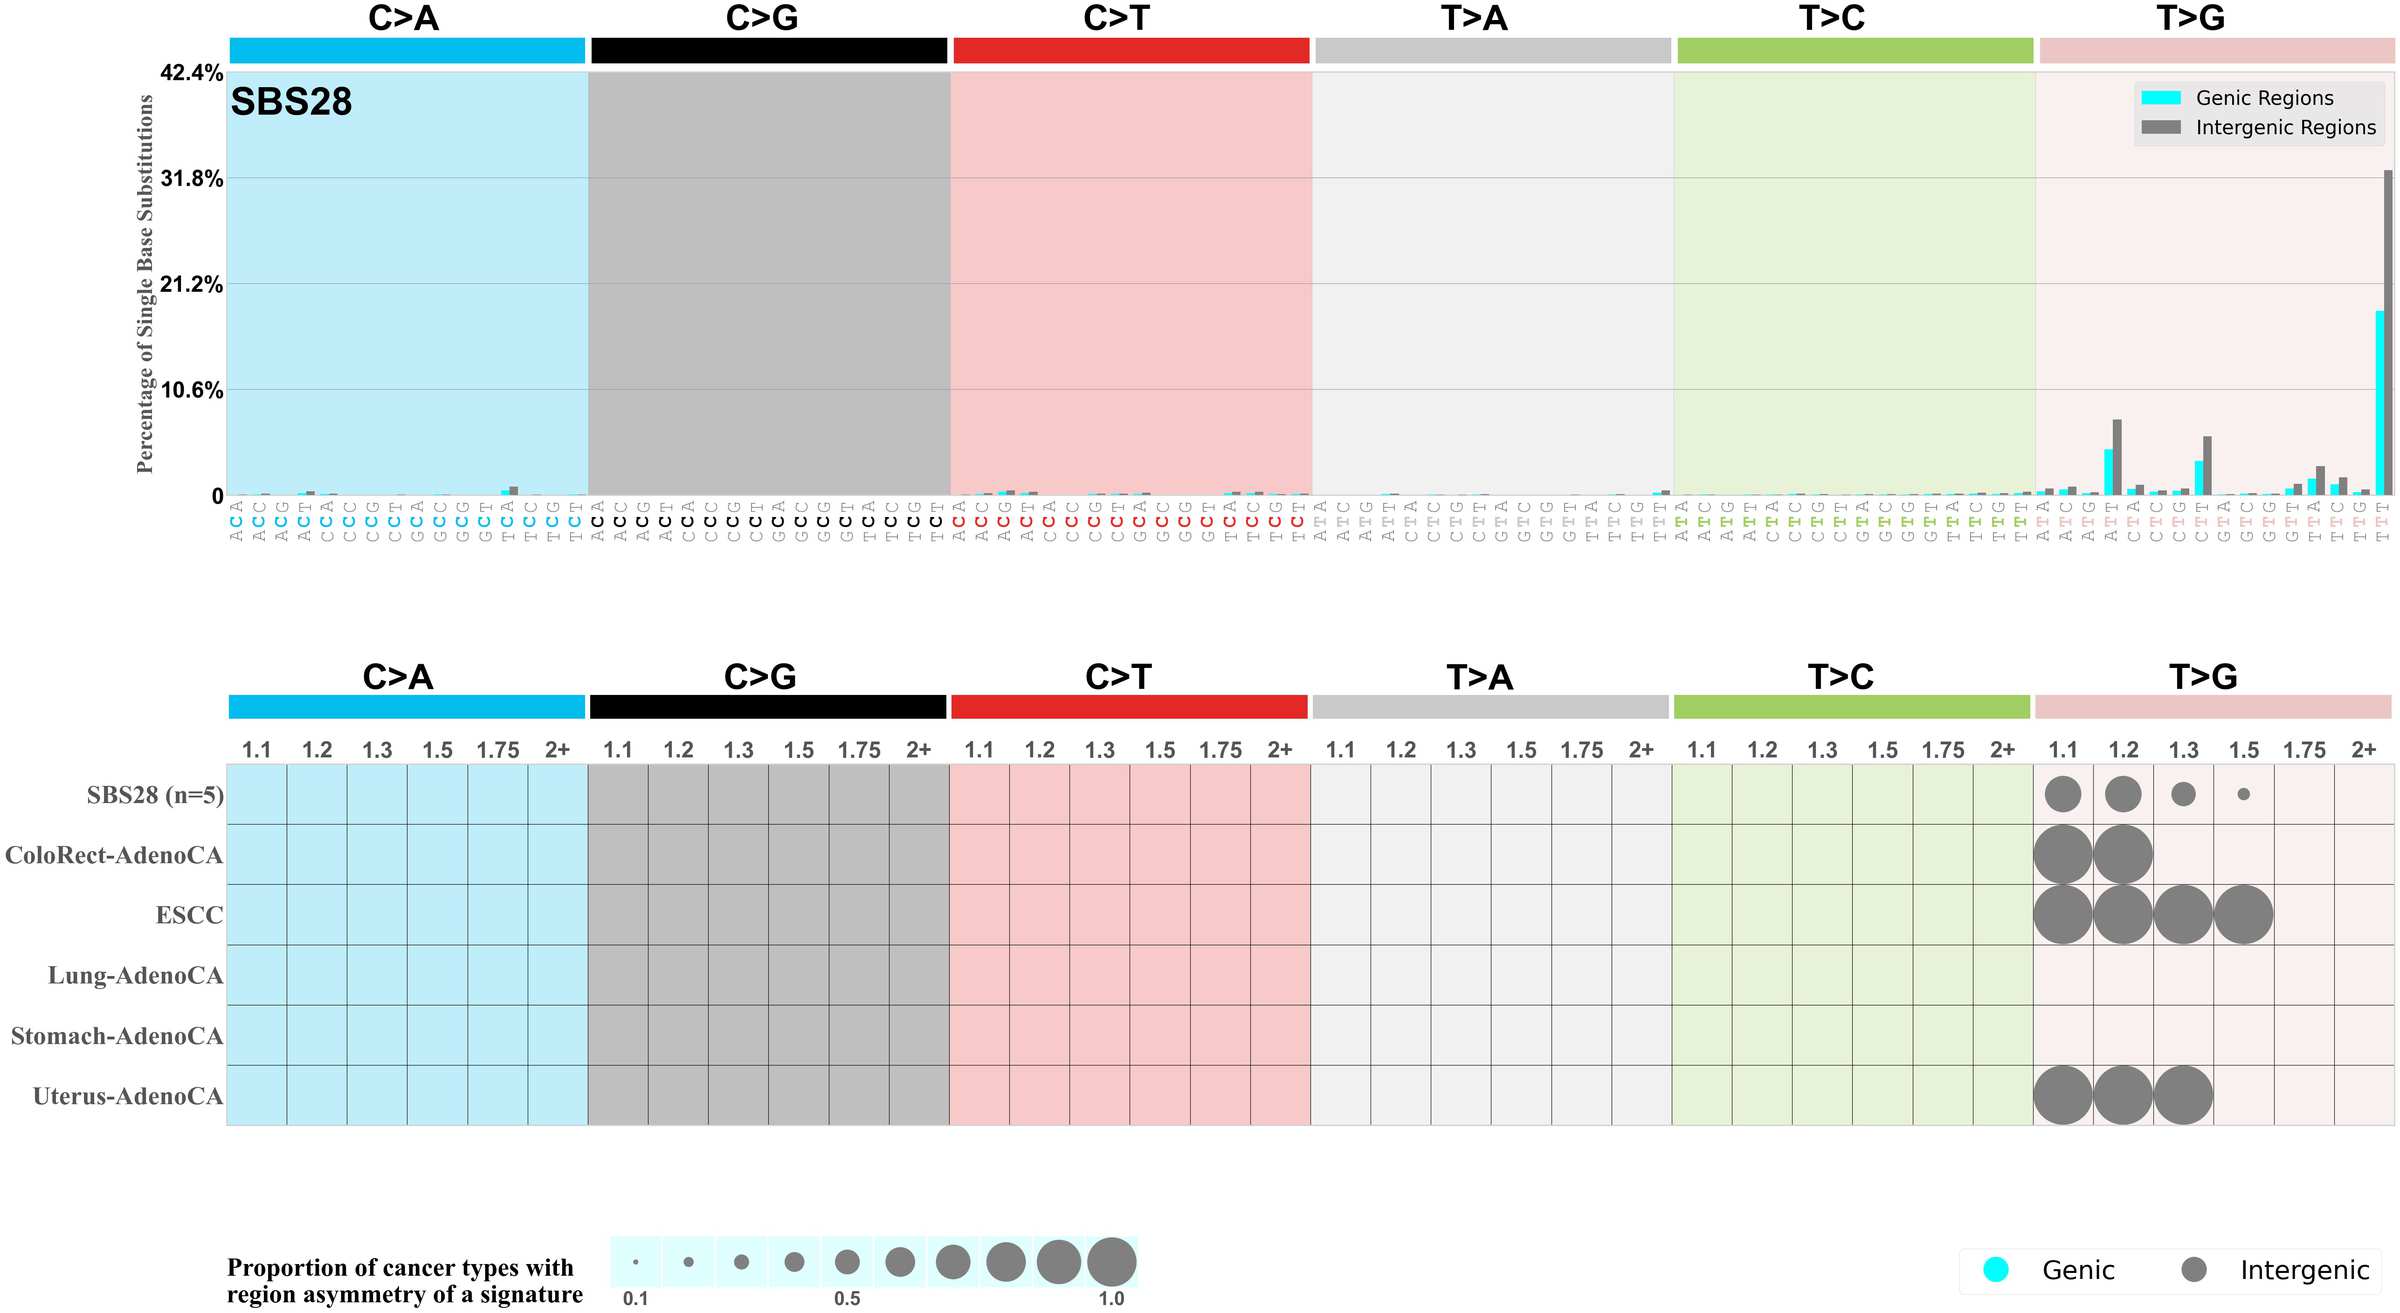
Mutational signatures can leave their mark in the form of differential mutational frequencies between the two DNA regions: genic regions and intergenic regions.
The upper bar plot represents the percentage of real mutations in genic and intergenic regions averaged across the human genome as well as all examined samples in 96 mutational context.
In the lower circle plot, the circles are filled with the colour of the significant region when there is an odds ratio of at least 1.1 with statistical significance. The first row of this plot displays the genic versus intergenic region asymmetry across all cancer types, while the remaining rows present genic versus intergenic region asymmetry for each cancer type.
Each mutation attributed to the mutational signature is annotated as either on the genic region (transcribed strand or untranscribed strand) or intergenic region (non-transcribed strand).
The odds ratio is defined as the real mutations ratio divided by the simulated mutations ratio, where each ratio is calculated using the number of mutations on genic and intergenic regions. And the number of real mutations on genic and intergenic regions must be statistically significant with respect to the average number of simulated mutations on genic and intergenic regions.
The region with the higher number of real mutations defines the numerator of both the real mutations ratio and the simulated mutations ratio.
The region with the lower number of real mutations defines the denominator of both the real mutations ratio and the simulated mutations ratio.
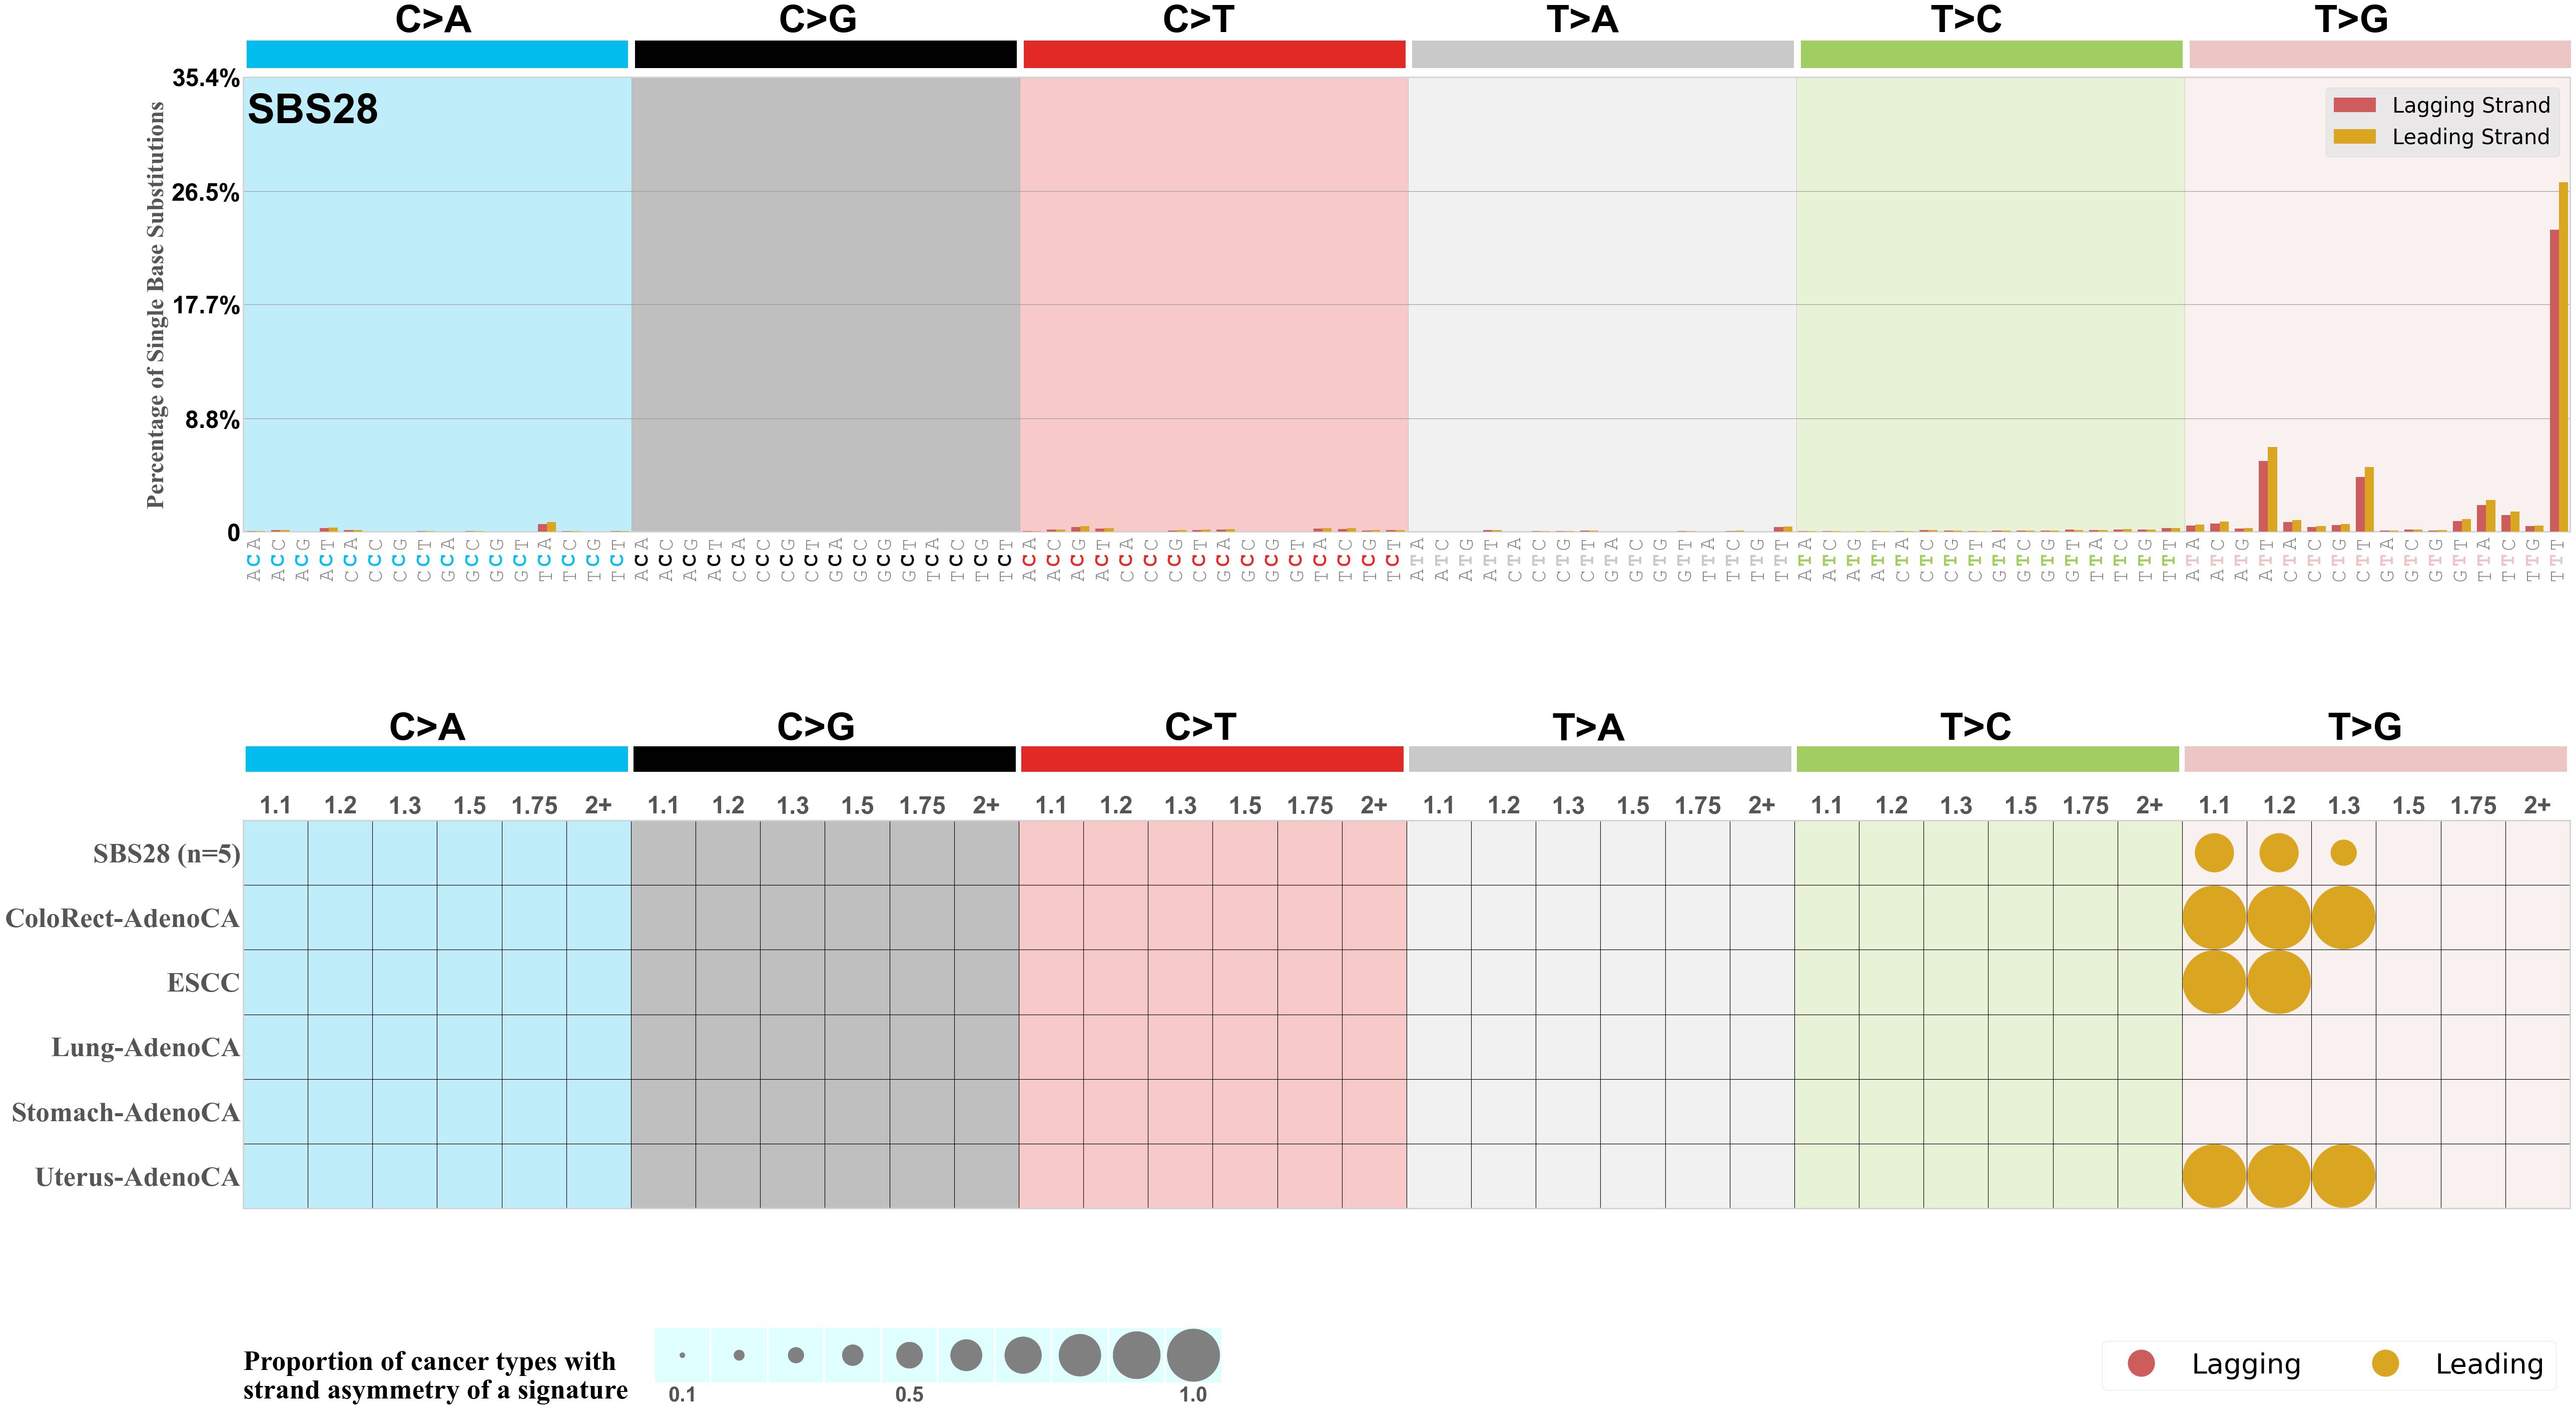
Replicational strand asymmetry
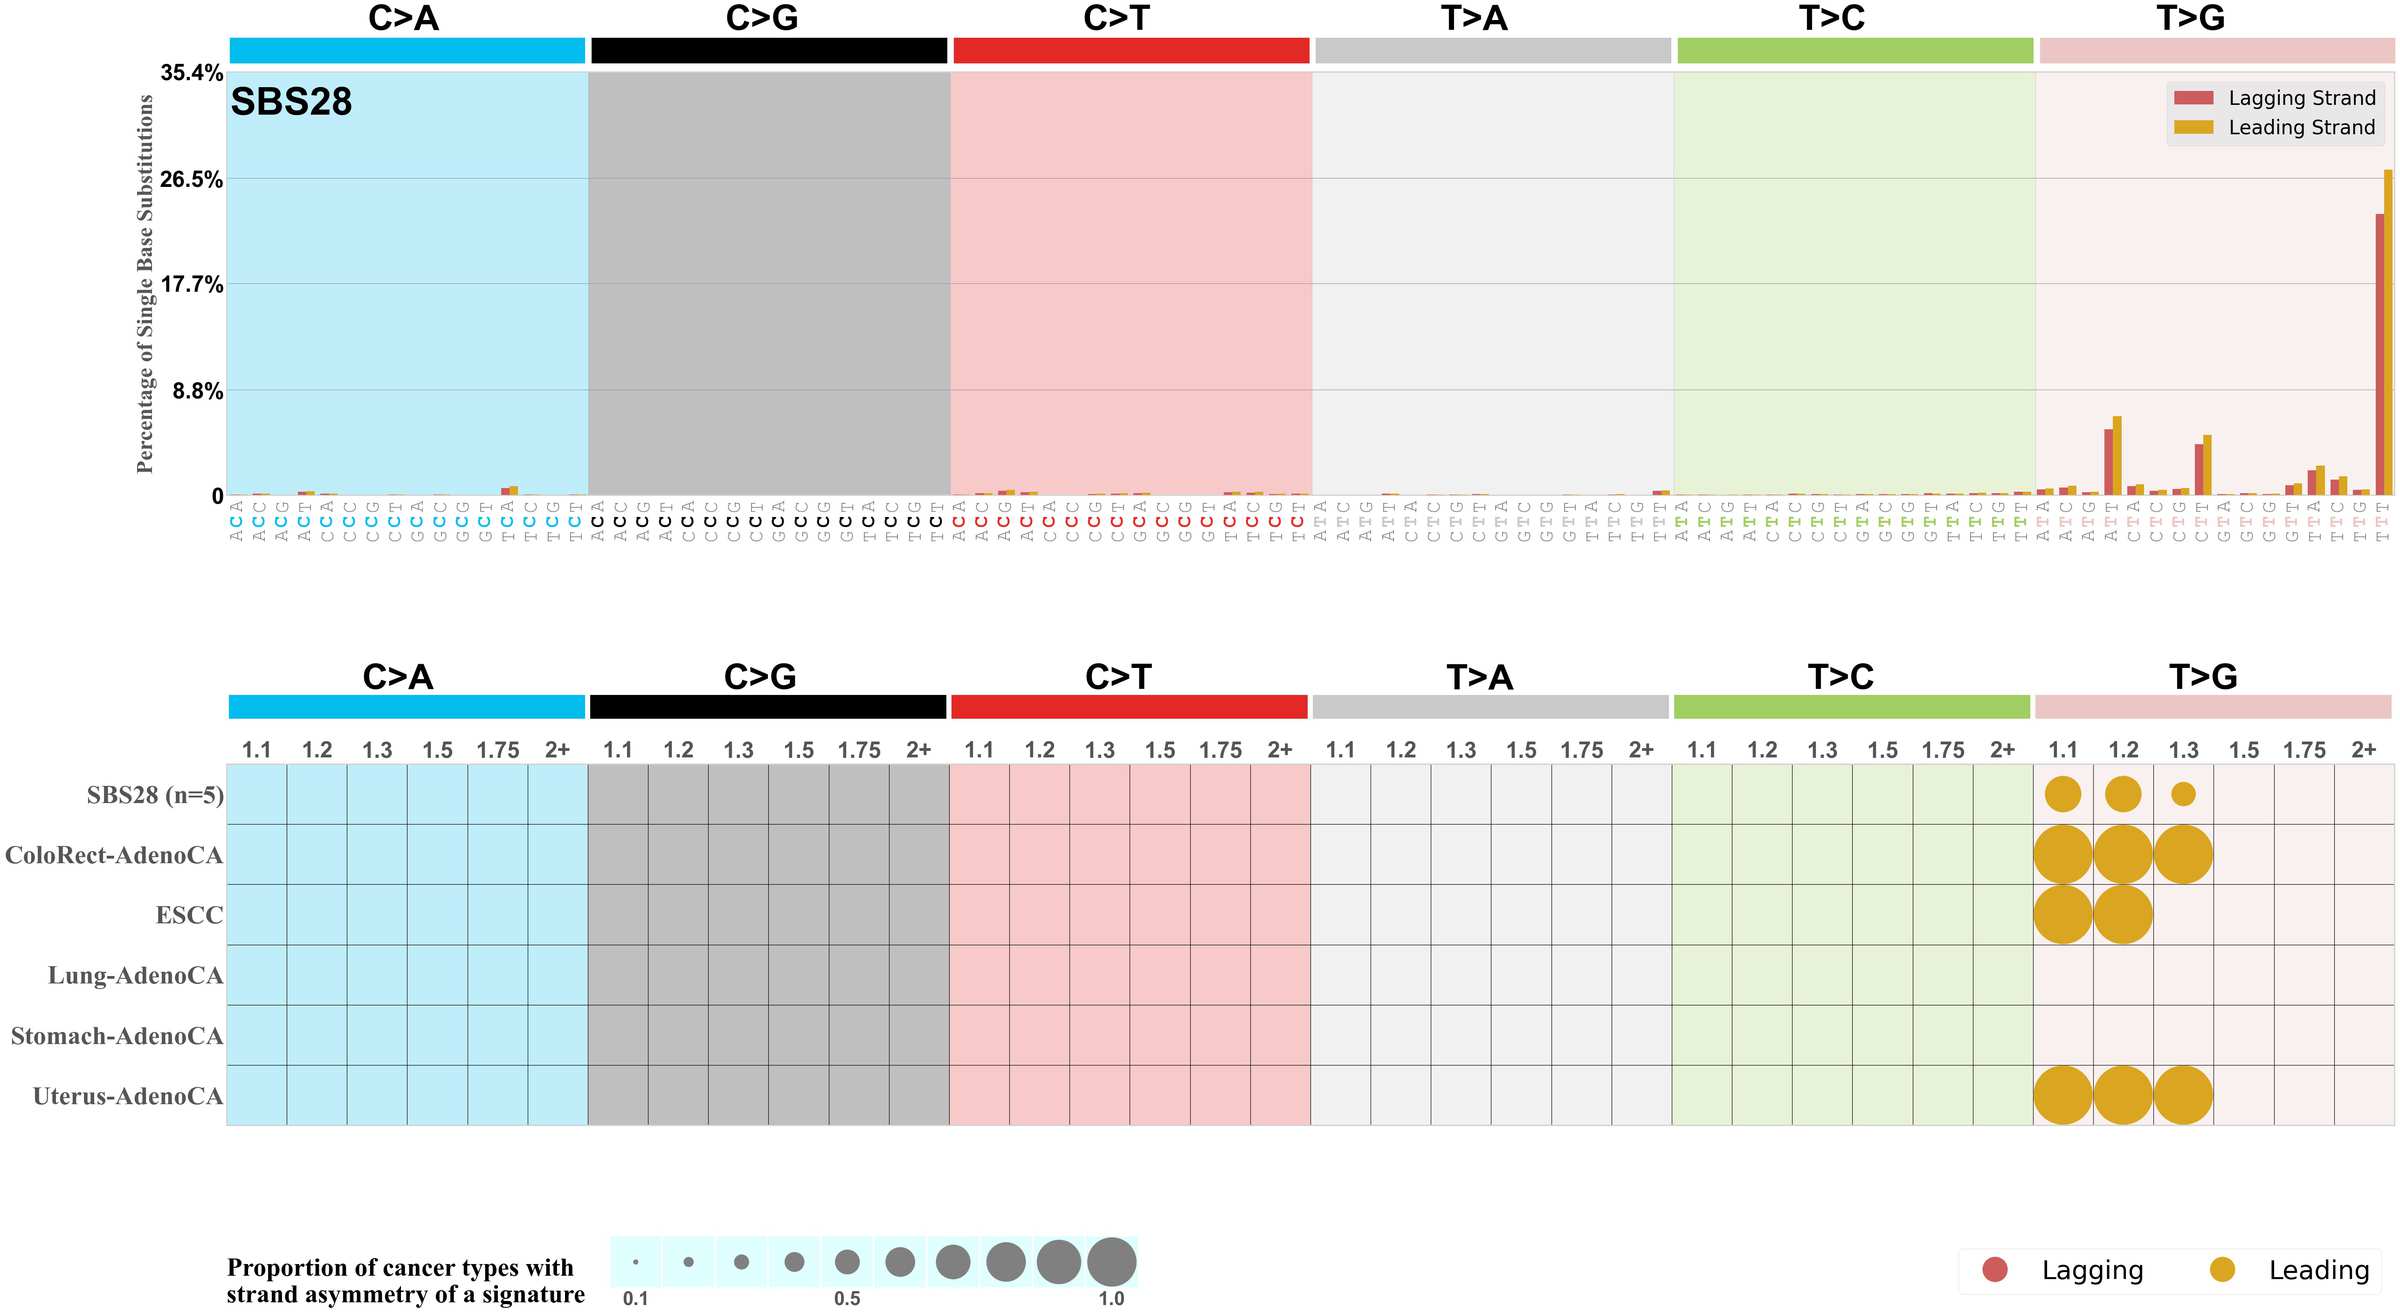
Mutational signatures exhibit asymmetric number of mutations due to either one of the DNA strands being preferentially repaired or one of the DNA strands having a higher propensity for being damaged. One common example of strand asymmetry is replication-strand asymmetry in which the DNA replication process may result in preferential mutagenesis of one of the strands.
The upper bar plot represents the percentage of real mutations in lagging and leading strands averaged across the human genome as well as all examined samples in 96 mutational context.
In the lower circle plot, the circles are filled with the colour of the significant strand when there is an odds ratio of at least 1.1 with statistical significance. The first row of this plot displays the replicational strand asymmetry across all cancer types, while the remaining rows present replicational strand asymmetry for each cancer type.
Each mutation attributed to the mutational signature is annotated as either on the lagging strand or the leading strand.
The odds ratio is defined as the real mutations ratio divided by the simulated mutations ratio, where each ratio is calculated using the number of mutations on lagging and leading strands. And the number of real mutations on lagging and leading strands must be statistically significant with respect to the average number of simulated mutations on lagging and leading strands.
The strand with the higher number of real mutations defines the numerator of both the real mutations ratio and the simulated mutations ratio.
The strand with the lower number of real mutations defines the denominator of both the real mutations ratio and the simulated mutations ratio.
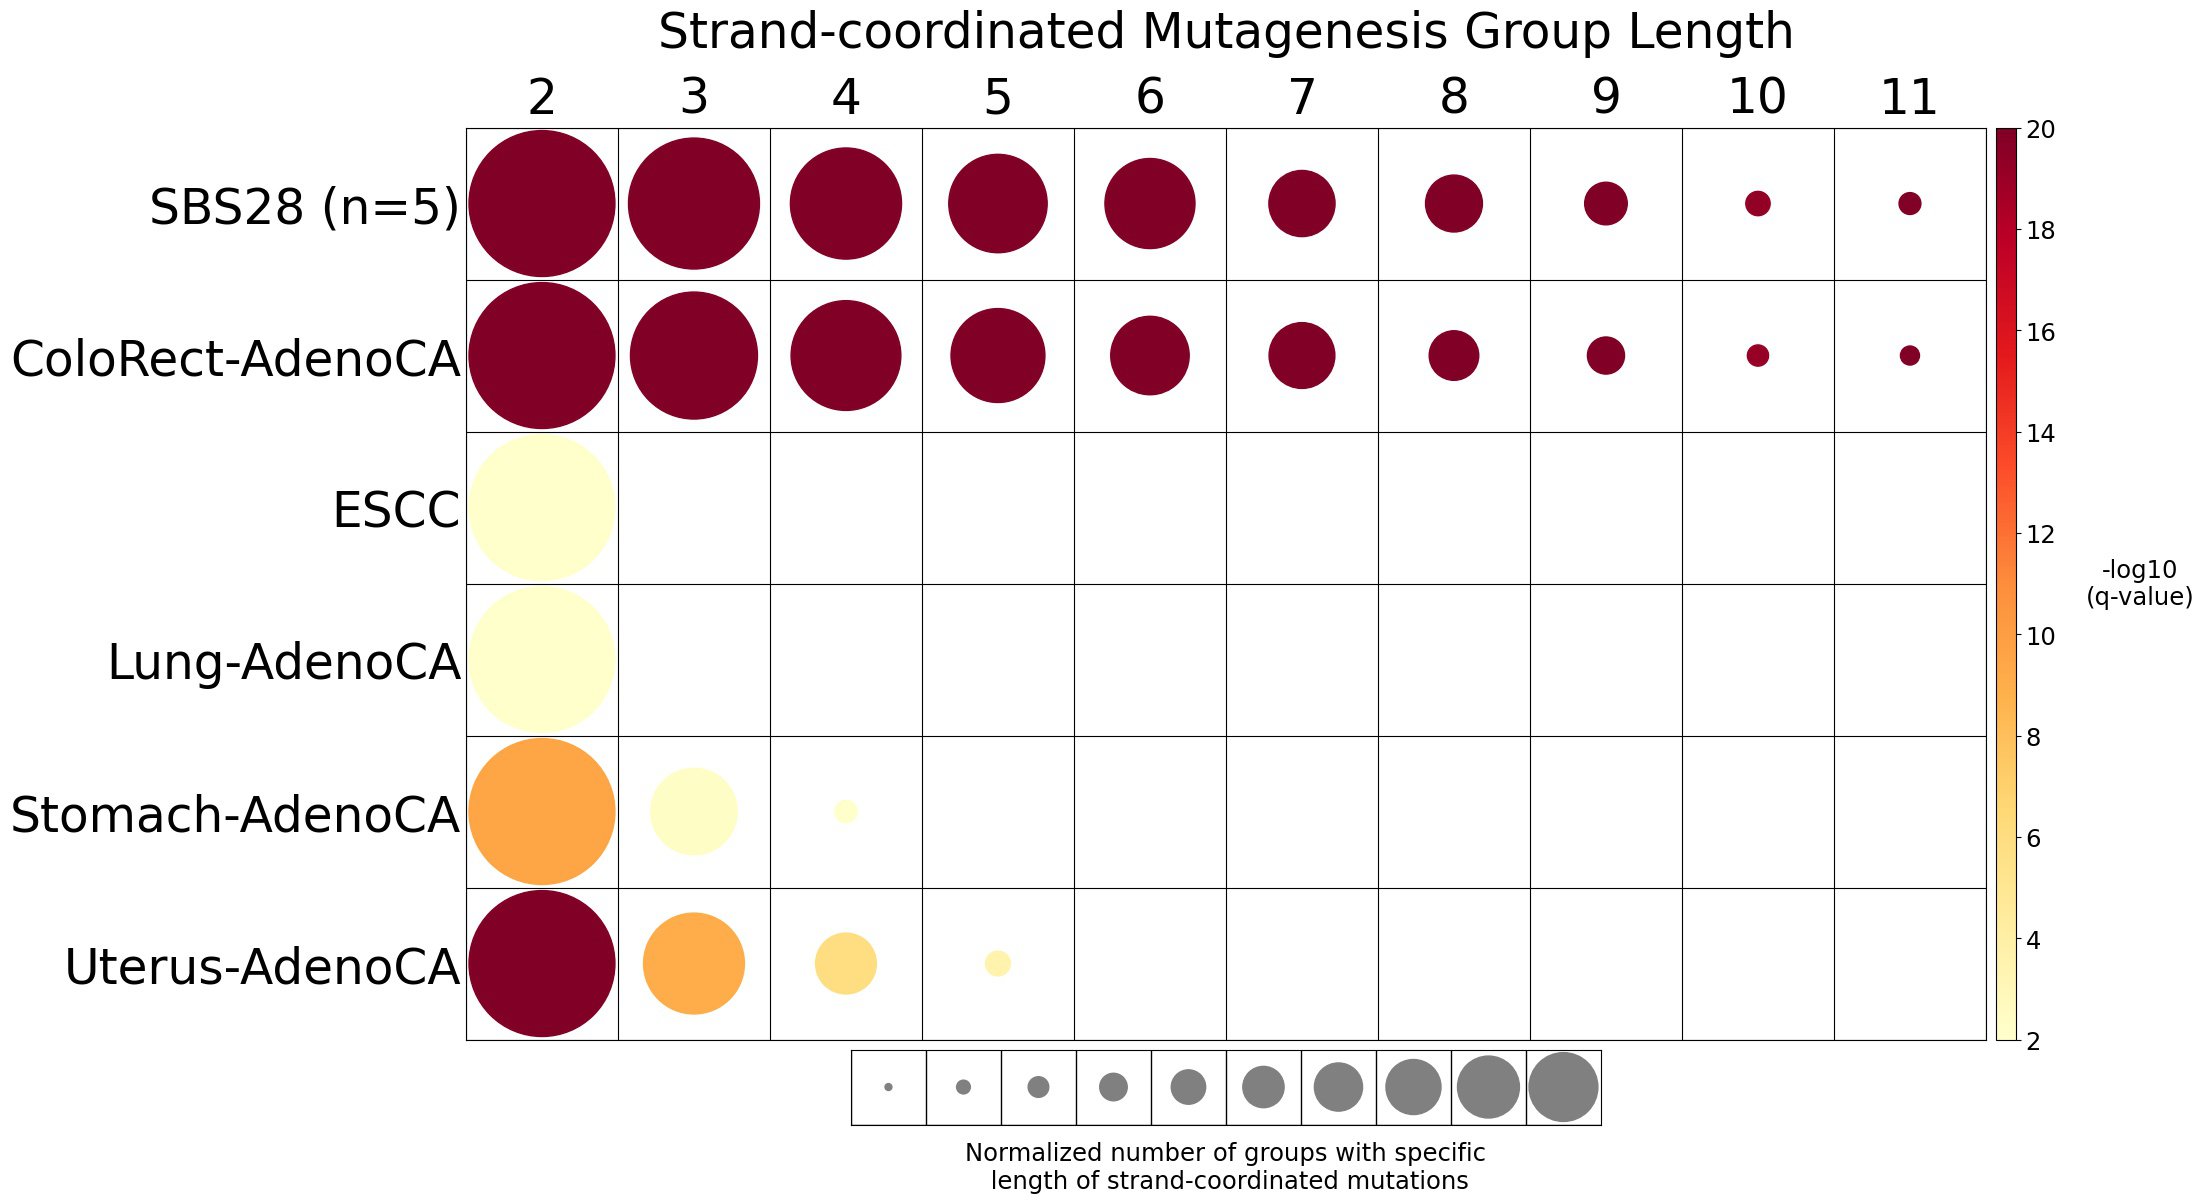
Strand-coordinated mutagenesis

Strand-coordinated mutagenesis analysis identifies groups of consecutive single-base substitutions on the same DNA strand with the same pyrimidine mutation context (e.g., consecutive C>A, C>A, C>A) attributed to the same mutational signature within a sample.
Somatic mutations are defined as consecutive if the inter-mutational distance between any two mutations is less than 10 kb. Strand-coordinated groups of varying lengths are pooled across six mutation contexts and samples for each mutational signature. The circle radius reflects the number of strand-coordinated groups, and the color shows the statistical significance of the observed number of strand-coordinated groups with respect to the expected ones coming from simulations for each group length. Circles filled with light gray color (if any) represents no statistical significance.