


Mutational Signatures (v3.6 - May 2026)
SBS23 · GRCh37 · COSMIC v104
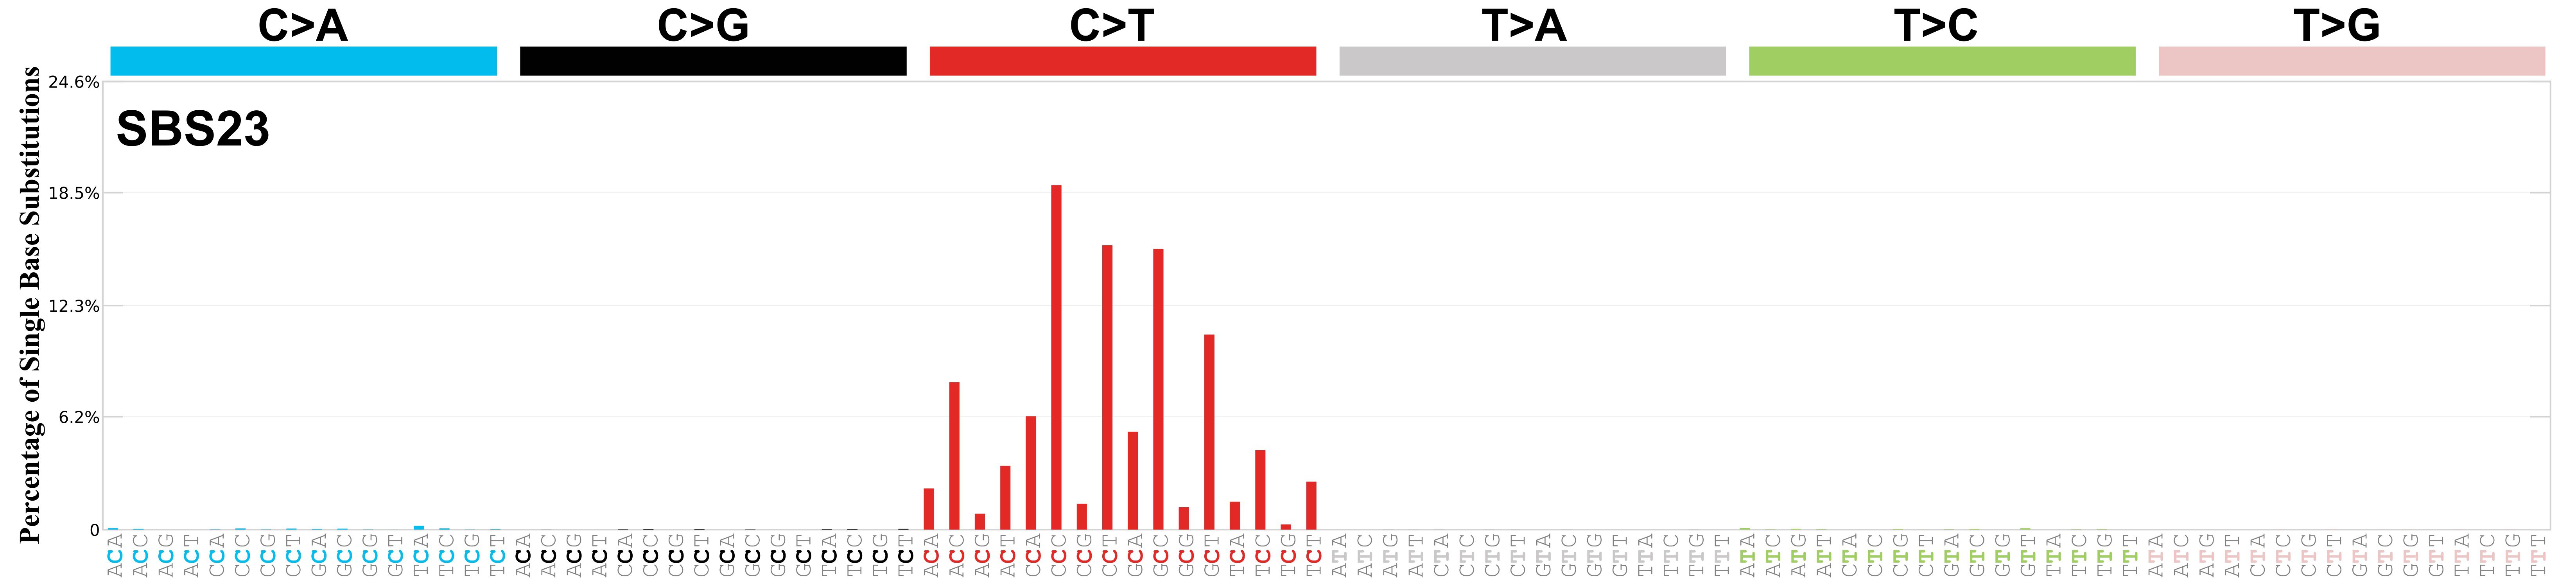
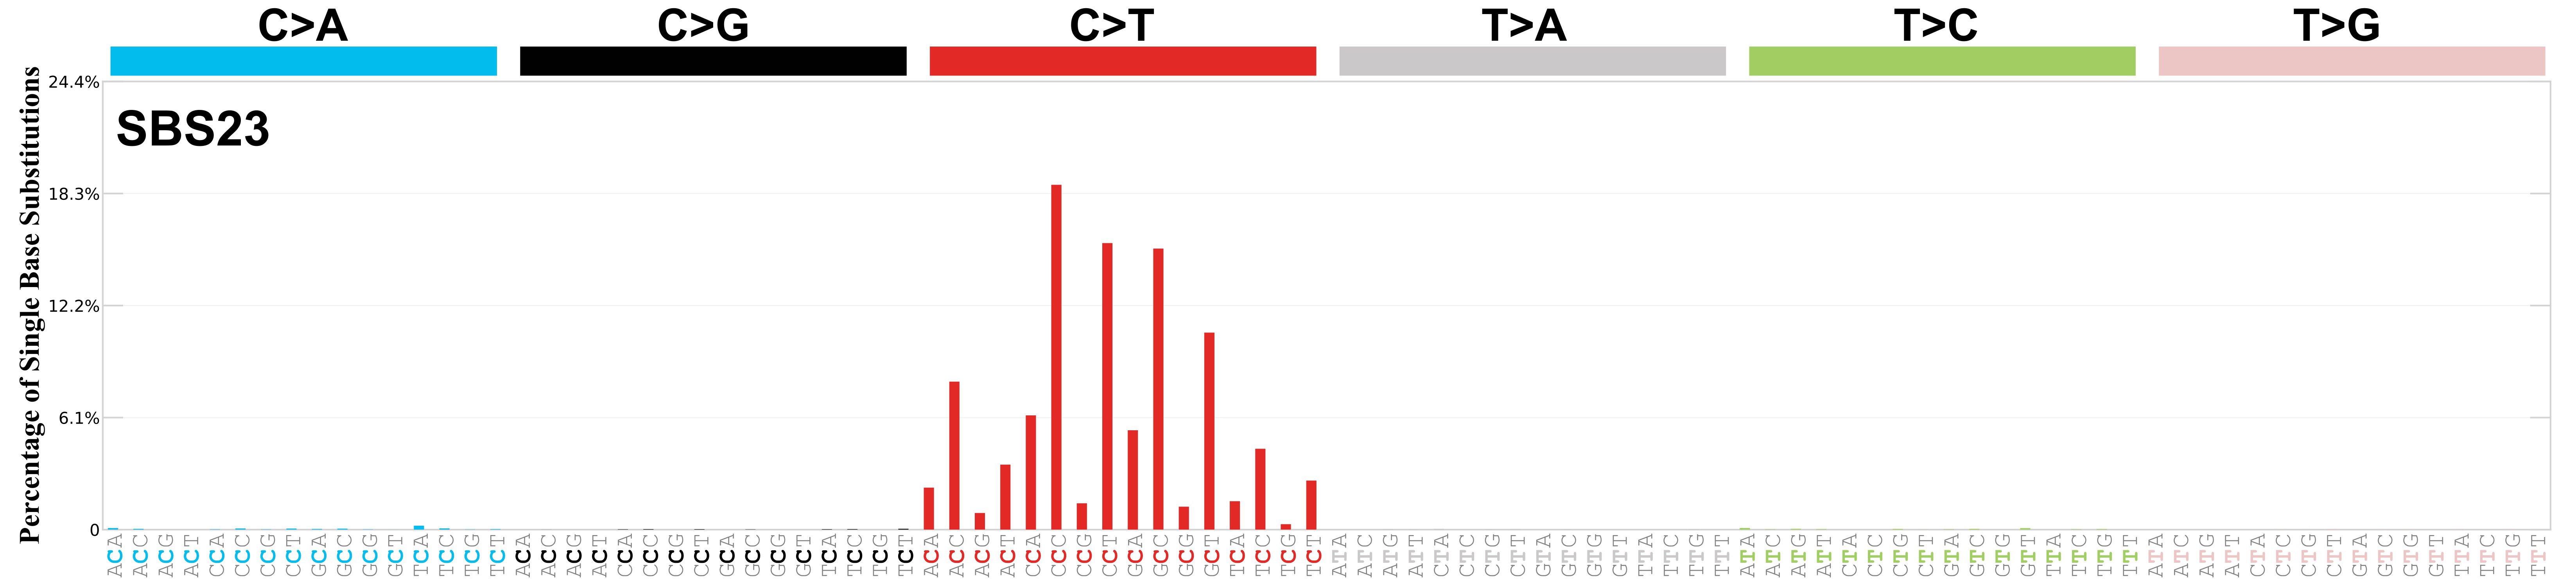
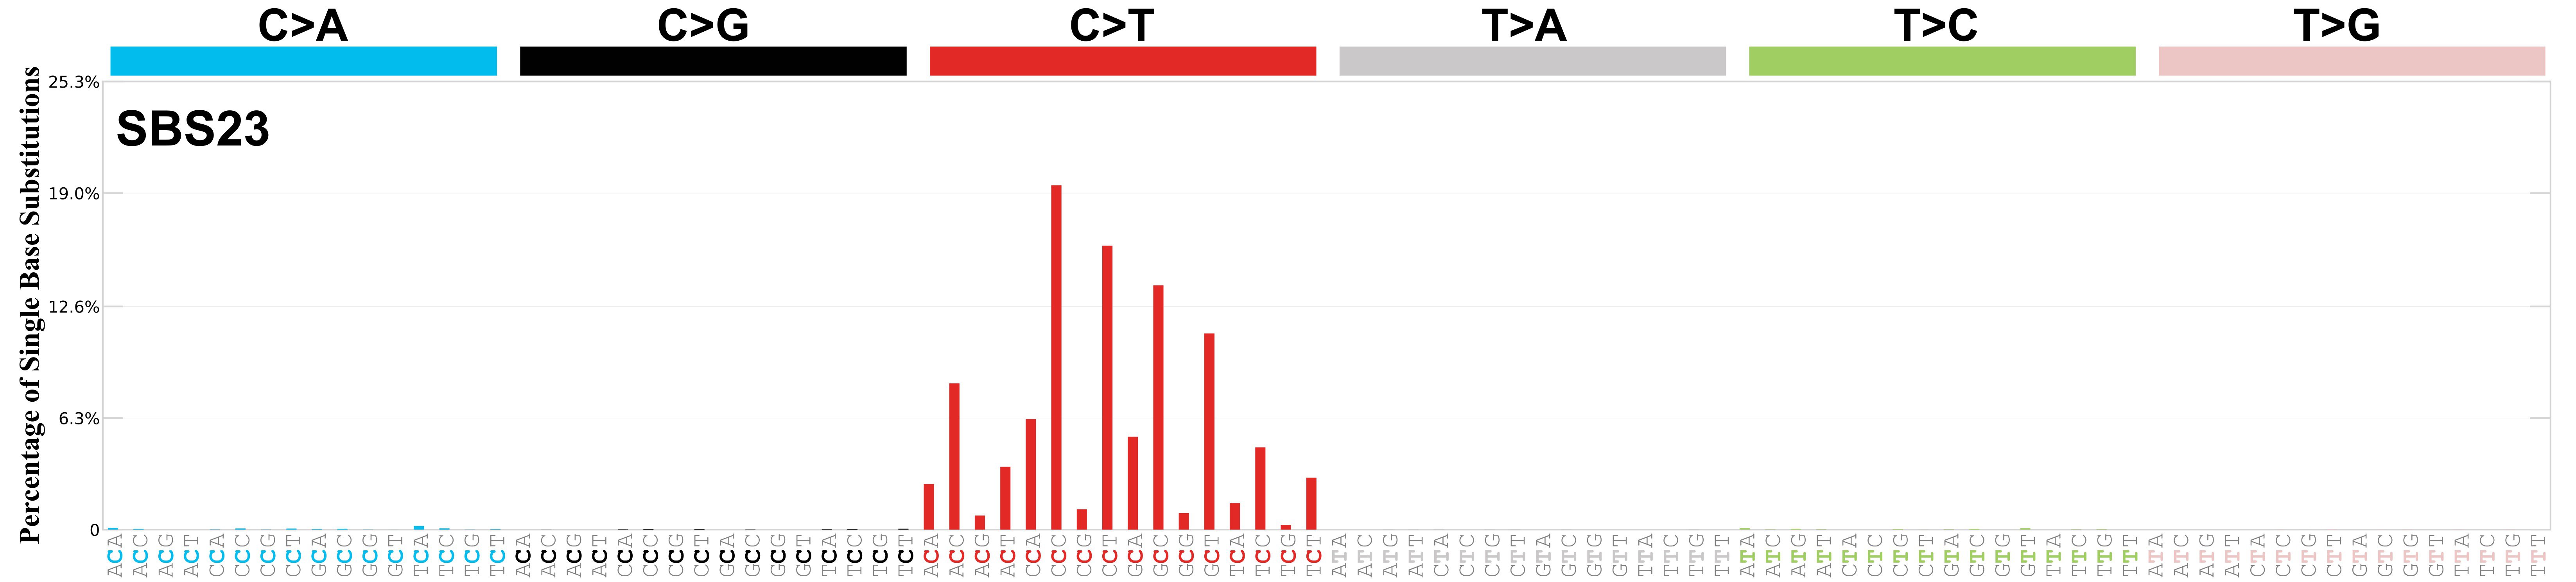
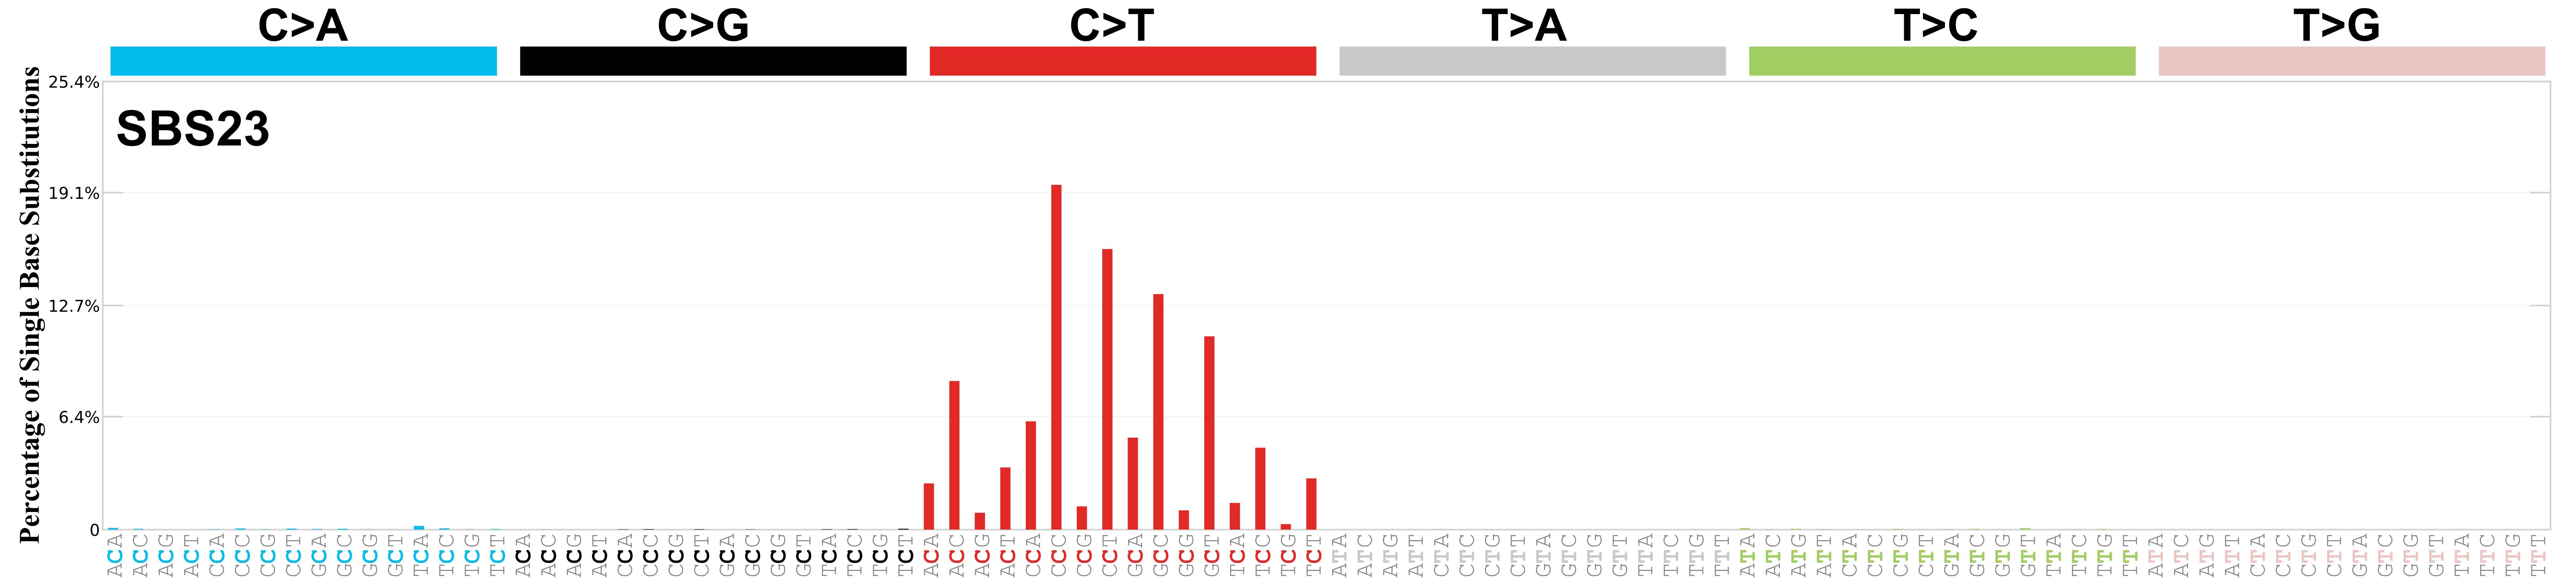
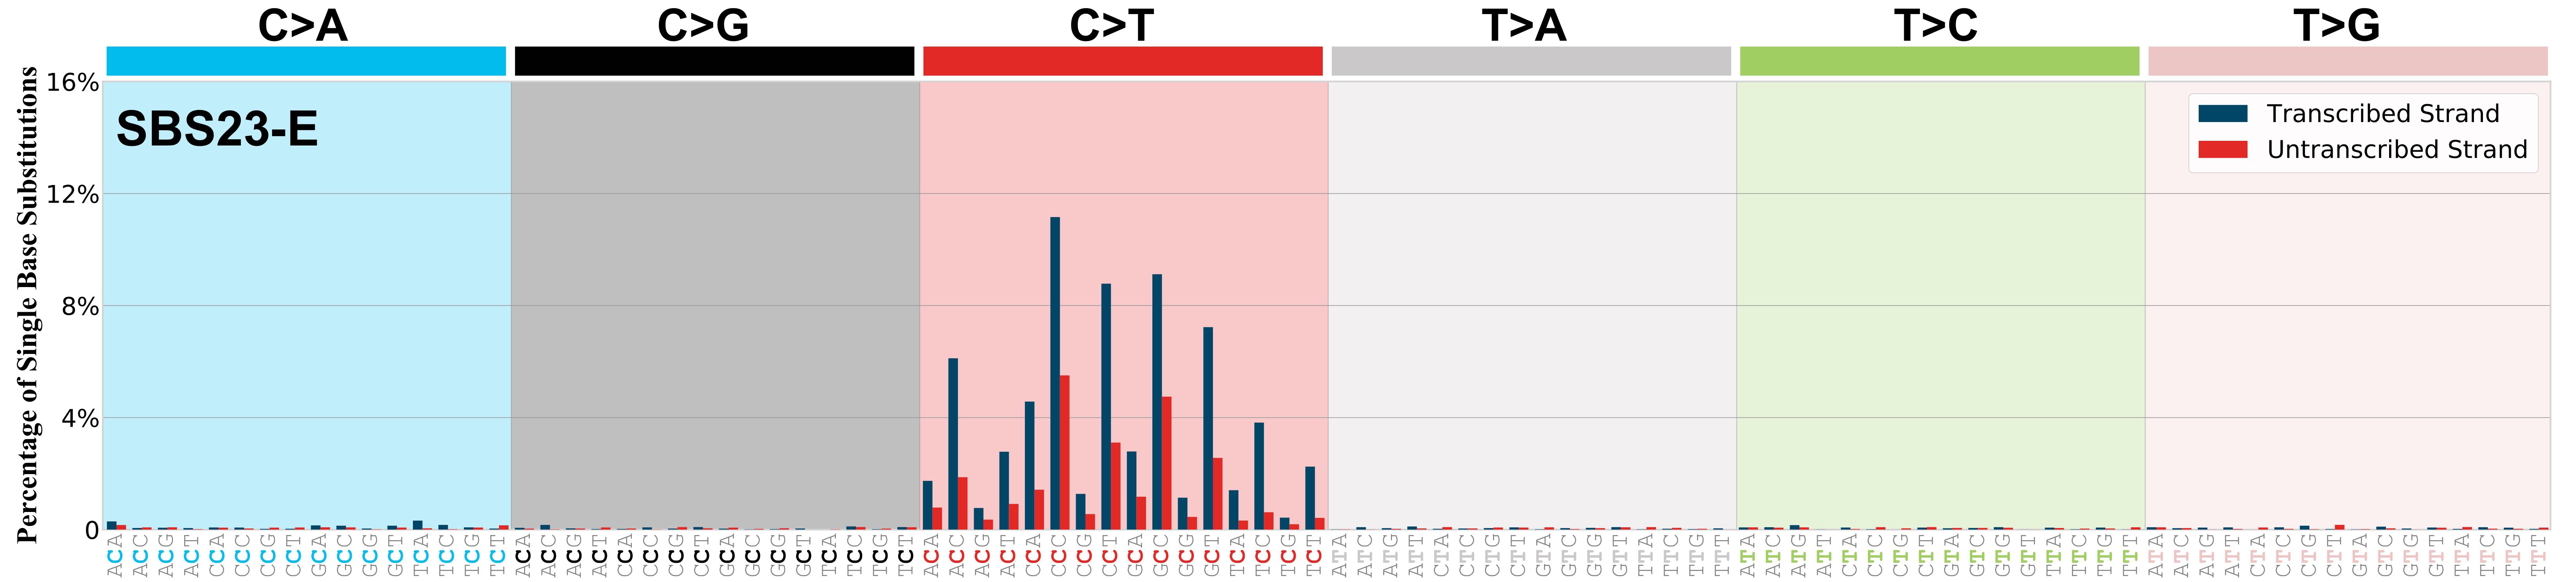
Mutational profile

Genome: GRCh37

Genome: GRCh38

Genome: mm9

Genome: mm10

Genome: rn6
Mutational profile using the conventional 96 mutation type classification. This classification is based on the six substitution subtypes: C>A, C>G, C>T, T>A, T>C, and T>G, as well as the nucleotides immediately 5’ and 3’ to the mutation.
Each of the substitutions is referred to by the pyrimidine of the mutated Watson—Crick base pair. Incorporating information on the bases immediately 5’ and 3’ to each mutated base generates 96 possible mutation types (6 types of substitution x 4 types of 5’ base x 4 types of 3’ base). Mutational signatures are displayed and reported based on the observed trinucleotide frequency of the genome, i.e., representing the relative proportions of mutations generated by each signature based on the actual trinucleotide frequencies of the corresponding reference genome.
Proposed aetiology
Unknown.
Acceptance criteria
| Background | Identification study | First included in COSMIC | |
|---|---|---|---|
| Alexandrov et al. 2015 Nature Genetics / Nik-Zainal et al. 2016 Nature | v2 | ||
| Identification | NGS technique | Different variant callers | Multiple sequencing centres |
| WES | Yes | Yes | |
| Technical validation | Validated in orthogonal techniques | Replicated in additional studies | Extended context enrichment |
| Yes | Yes | - | |
| Proposed aetiology | Mutational process | Support | |
| Unknown | Unknown | ||
| Experimental validation | Experimental study | Species | |
| - | - | ||
SBS23 exhibits strong transcriptional strand bias for C>T mutations with more mutations of G than C on the untranscribed strands of genes consistent with damage to guanine and repair by transcription-coupled nucleotide excision repair. Please note that SBS23 has only been found in exome sequencing data and, as such, the transcriptional strand bias reflects the one observed in the coding regions of the genome.
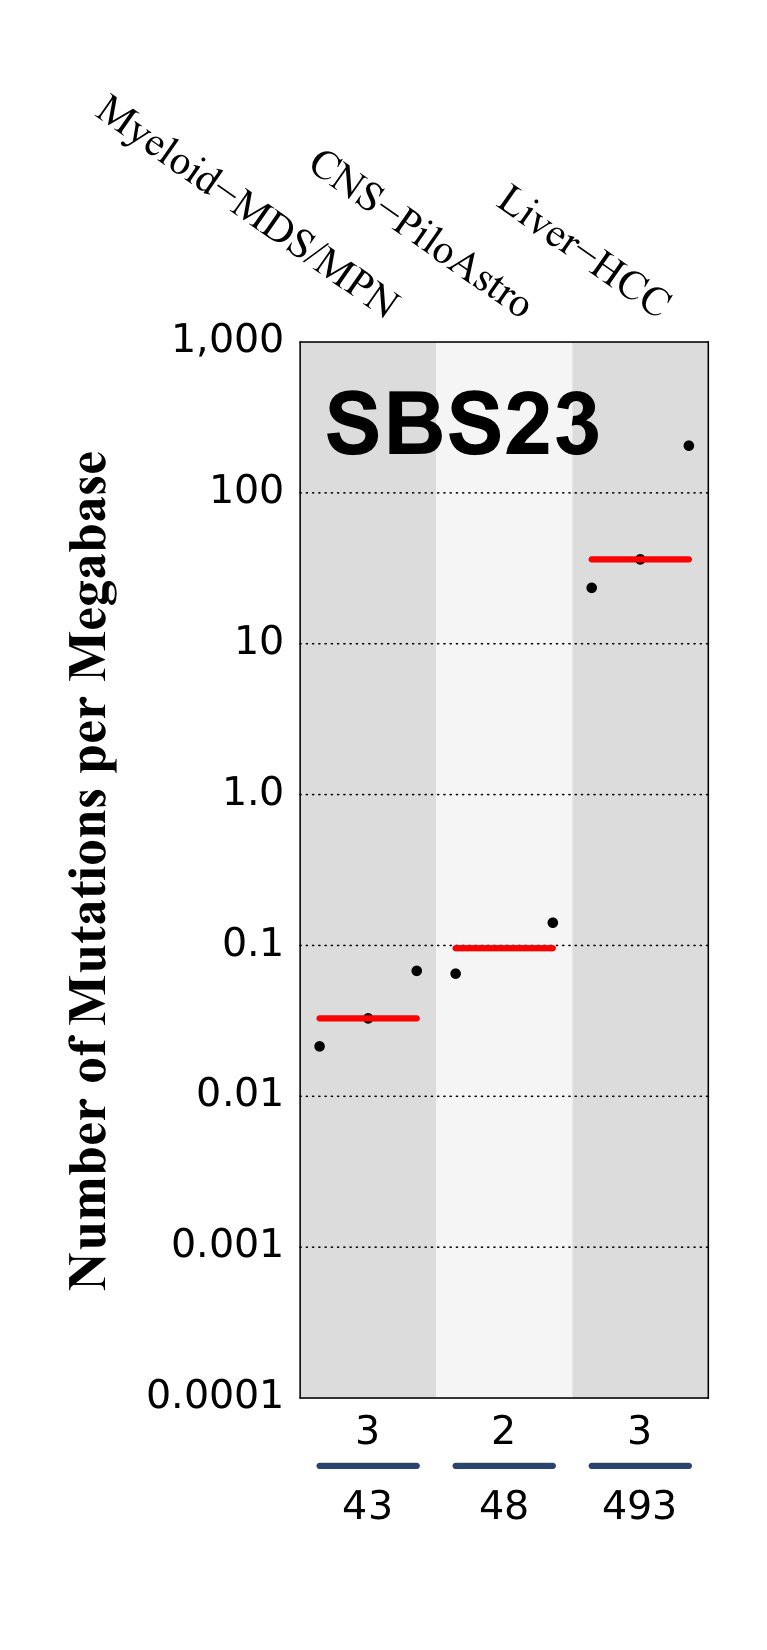
Tissue distribution
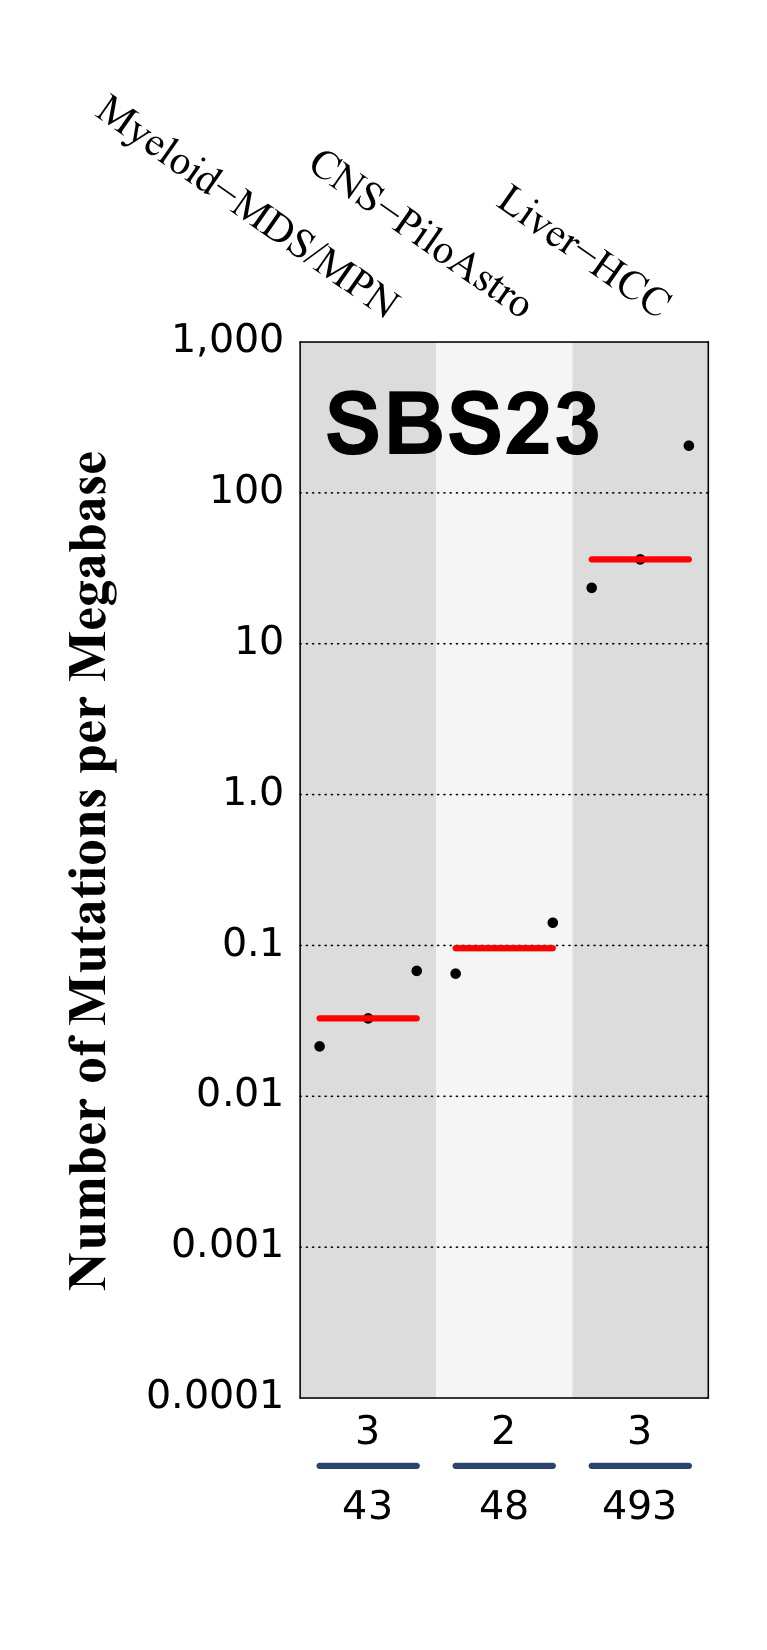
Numbers of mutations per megabase attributed to the mutational signature across the cancer types in which the signature was found. Each dot represents an individual sample and only samples where the signature is found are shown. The number of mutations per megabase was calculated by assuming that an average whole-exome has 30 Mb with sufficient coverage, whereas an average whole-genome has 2,800 Mb with sufficient coverage.
The numbers below the dots for each cancer type indicate the number of high confidence tumours in which at least 10 mutations were attributed to the signature (above the blue horizontal line) and the total number of high confidence tumours analysed (below the blue horizontal line). Only high confidence data are displayed: samples with reconstruction accuracy >0.90. The number of mutations per megabase was calculated by assuming that an average exome has 30 Mb with sufficient coverage, whereas an average whole genome has 2,800 Mb with sufficient coverage.
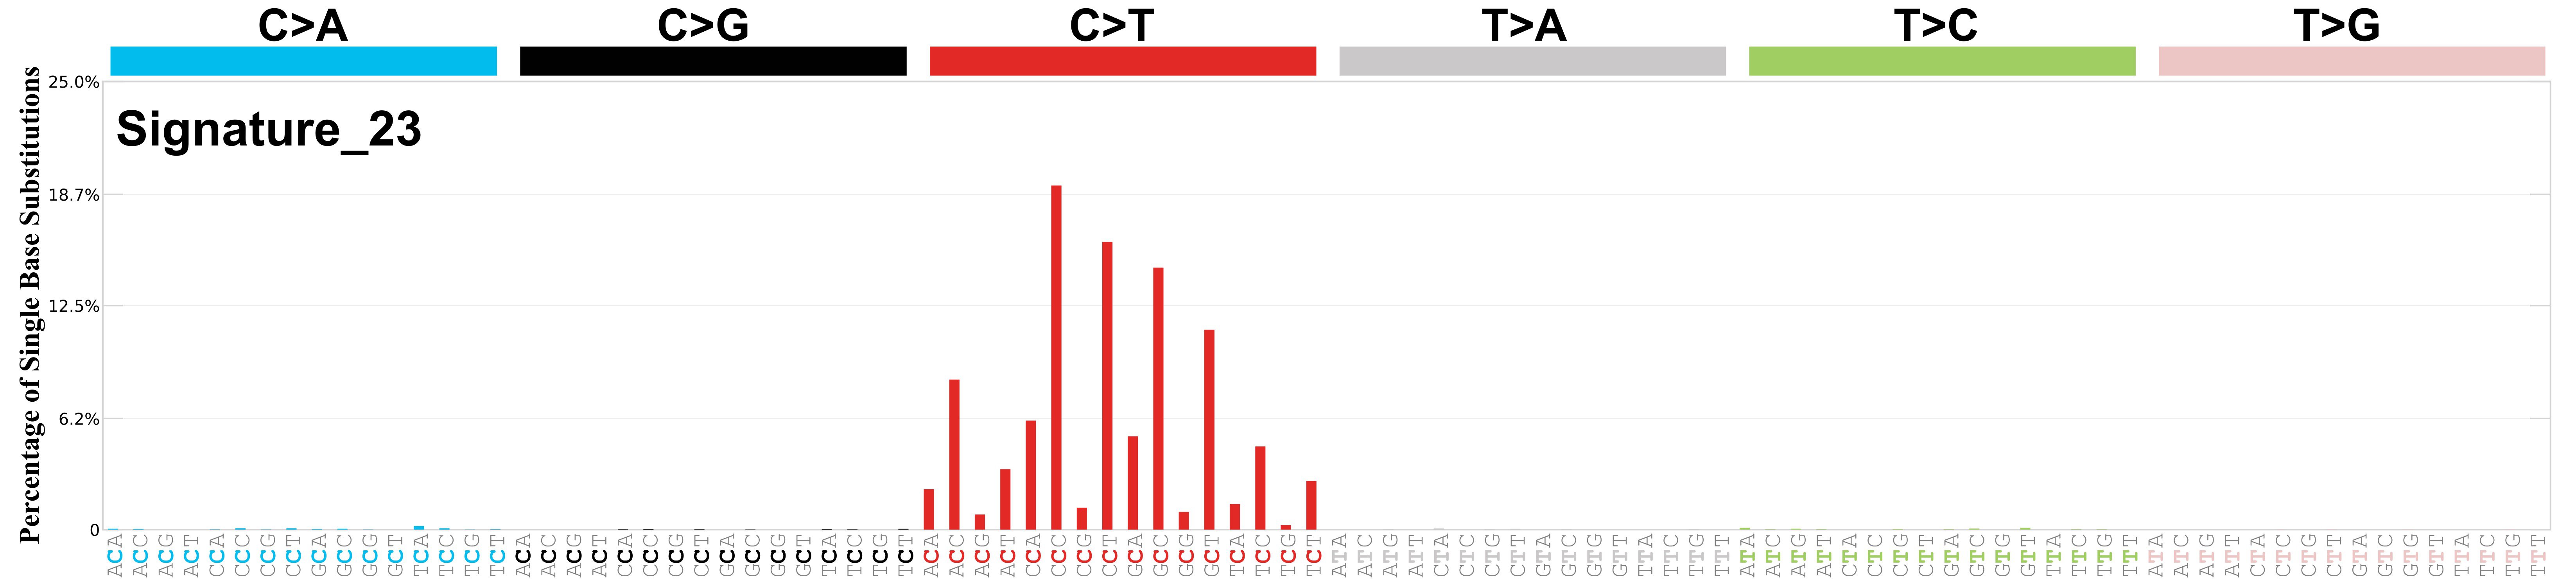
Differences between current and previous profiles

Genome: GRCh37

Genome: GRCh38

Genome: mm9

Genome: mm10

Genome: rn6
The cosine similarity between the prior and current versions of SBS23 is 1.00.
Replication timing
Topography analysis could not be performed for replication timing as the number of mutations satisfying our constraints was insufficient or this signature was not yet analysed.
Nucleosome occupancy
Topography analysis could not be performed for nucleosome occupancy as the number of mutations satisfying our constraints was insufficient or this signature was not yet analysed.
CTCF occupancy
Topography analysis could not be performed for CTCF occupancy as the number of mutations satisfying our constraints was insufficient or this signature was not yet analysed.
Histone modifications
Topography analysis could not be performed for histone modifications as the number of mutations satisfying our constraints was insufficient or this signature was not yet analysed.
Transcriptional strand asymmetry
Topography analysis could not be performed for transcriptional strand asymmetry as the number of mutations satisfying our constraints was insufficient or this signature was not yet analysed.
Genic and intergenic regions
Topography analysis could not be performed for genic and intergenic region asymmetry as the number of mutations satisfying our constraints was insufficient or this signature was not yet analysed.
Replicational strand asymmetry
Topography analysis could not be performed for replicational strand asymmetry as the number of mutations satisfying our constraints was insufficient or this signature was not yet analysed.
Strand-coordinated mutagenesis
Topography analysis could not be performed for strand-coordinated mutagenesis as the number of satisfying our constraints was insufficient or this signature was not yet analysed.