


Mutational Signatures (v3.6 - May 2026)
SBS10d · GRCh37 · COSMIC v104
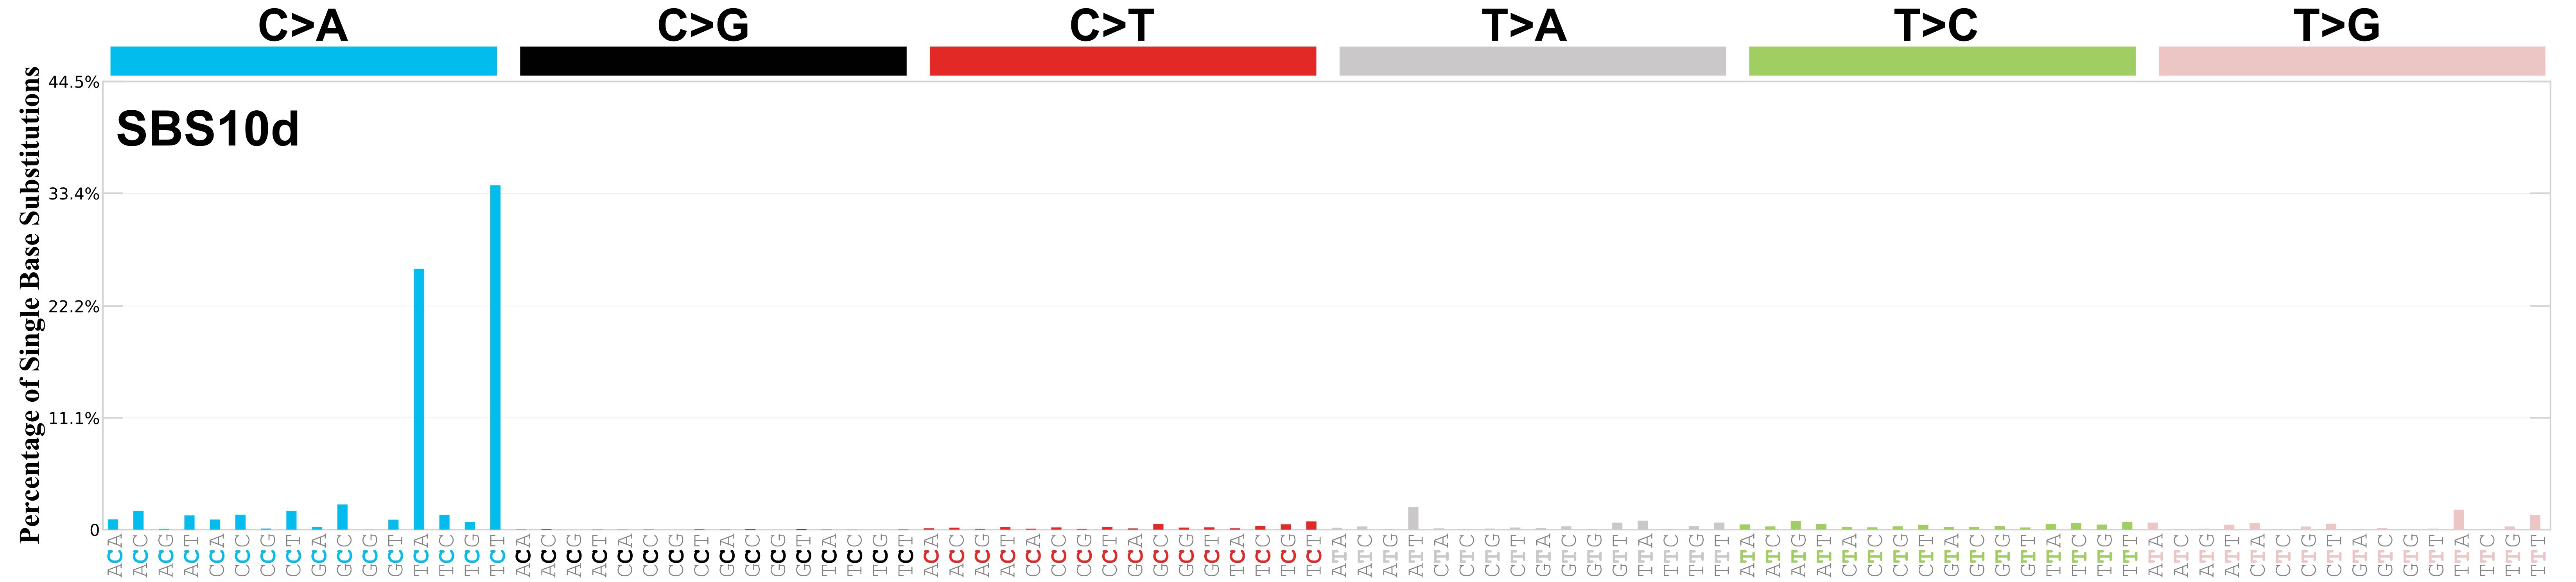
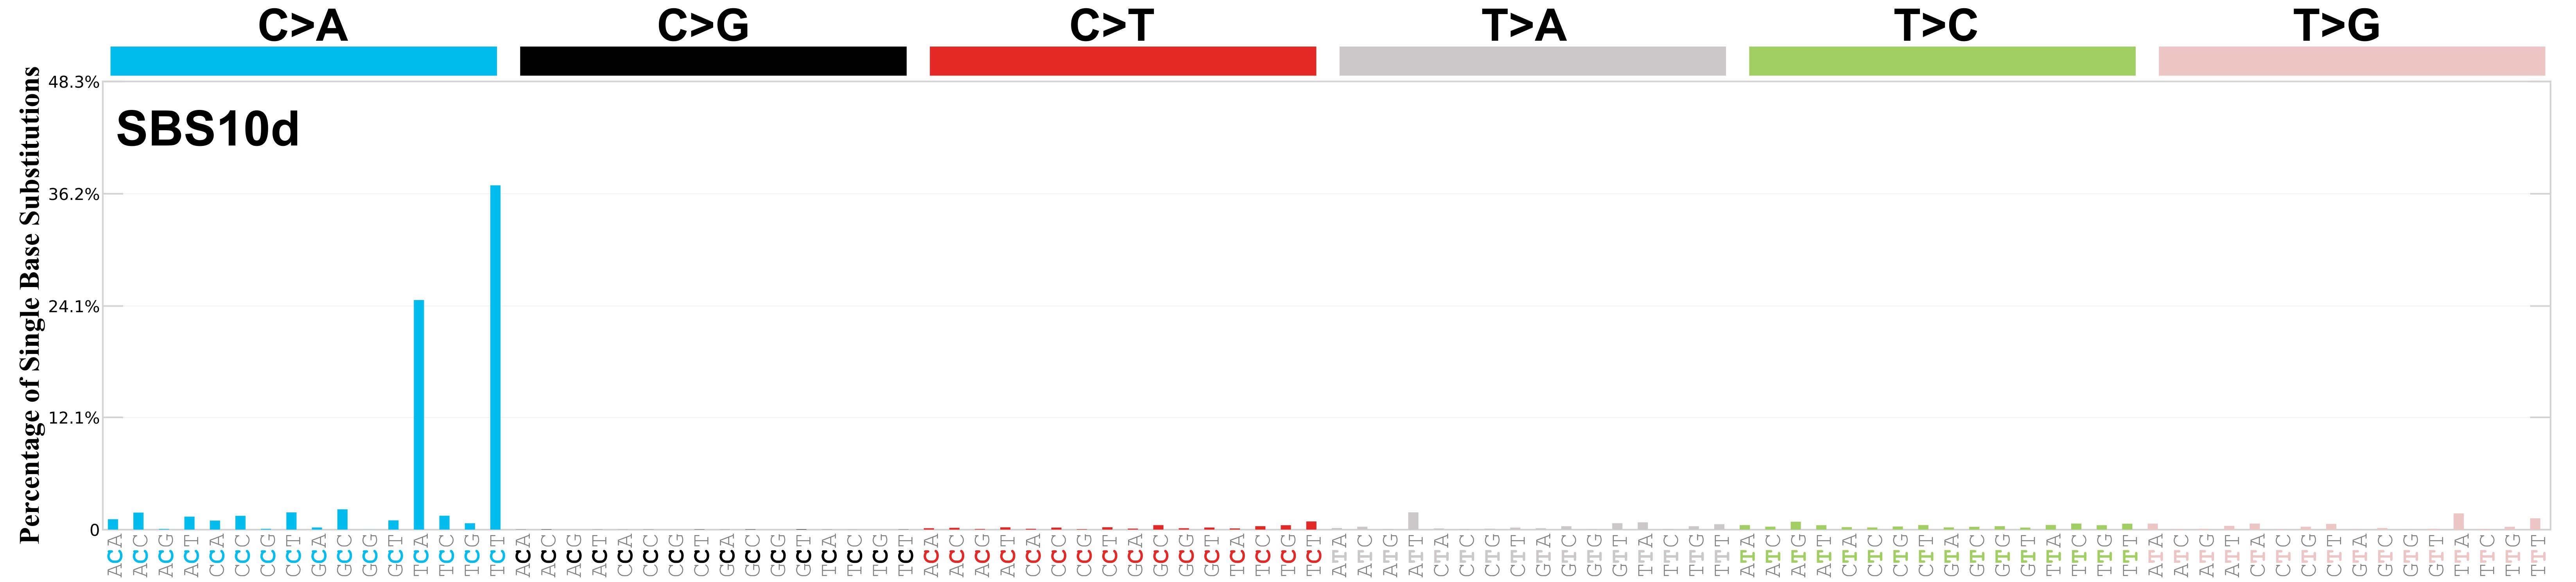
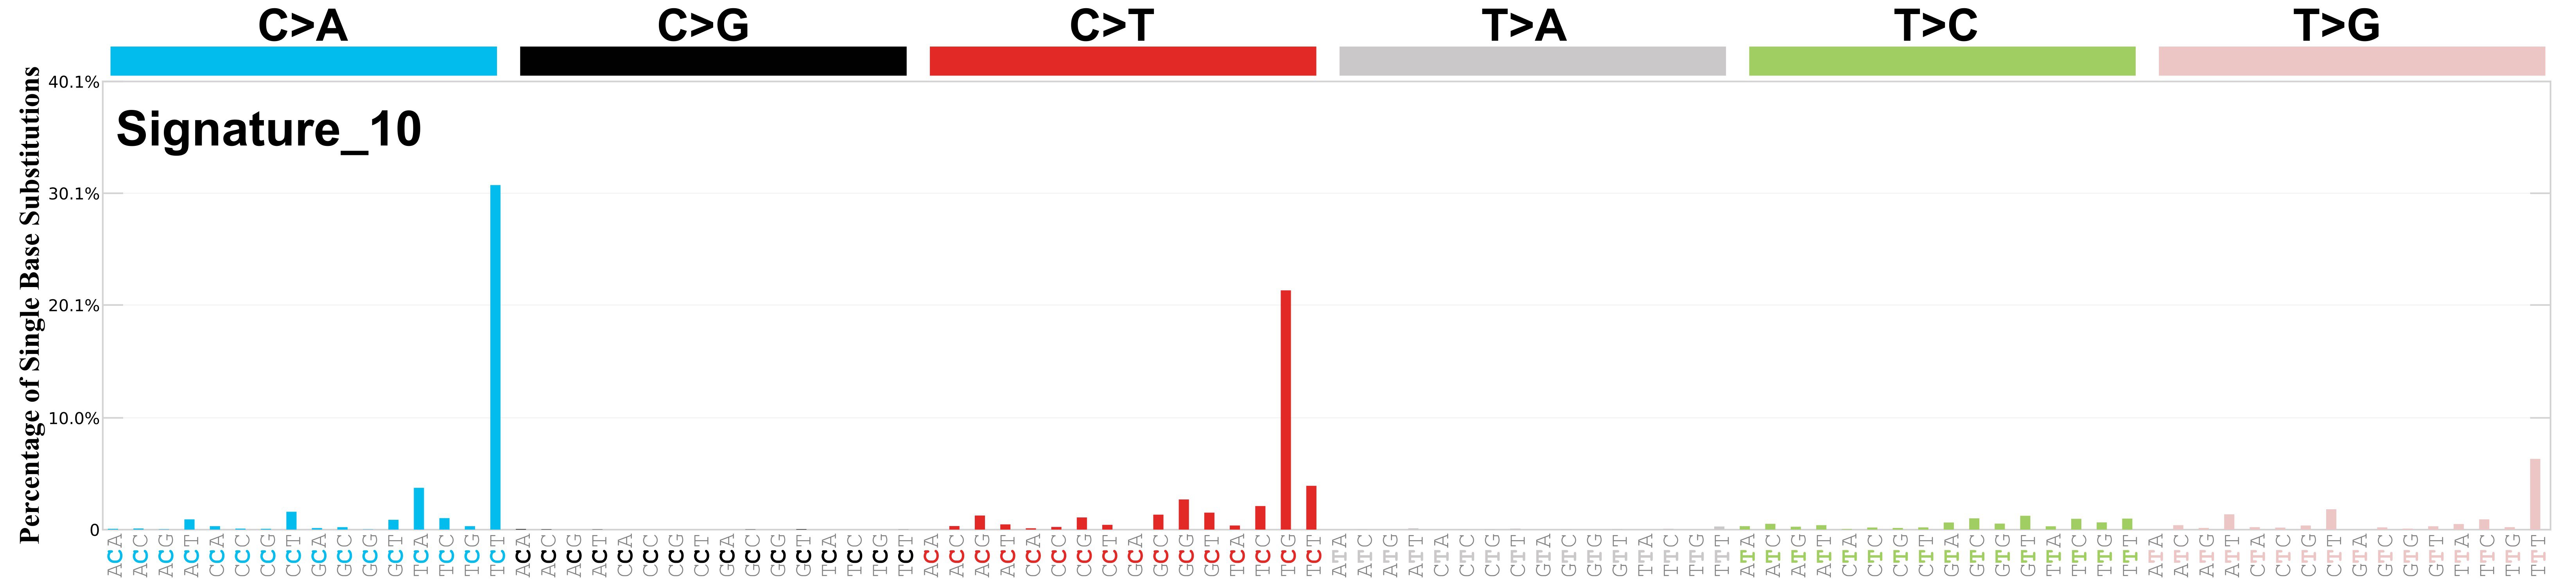
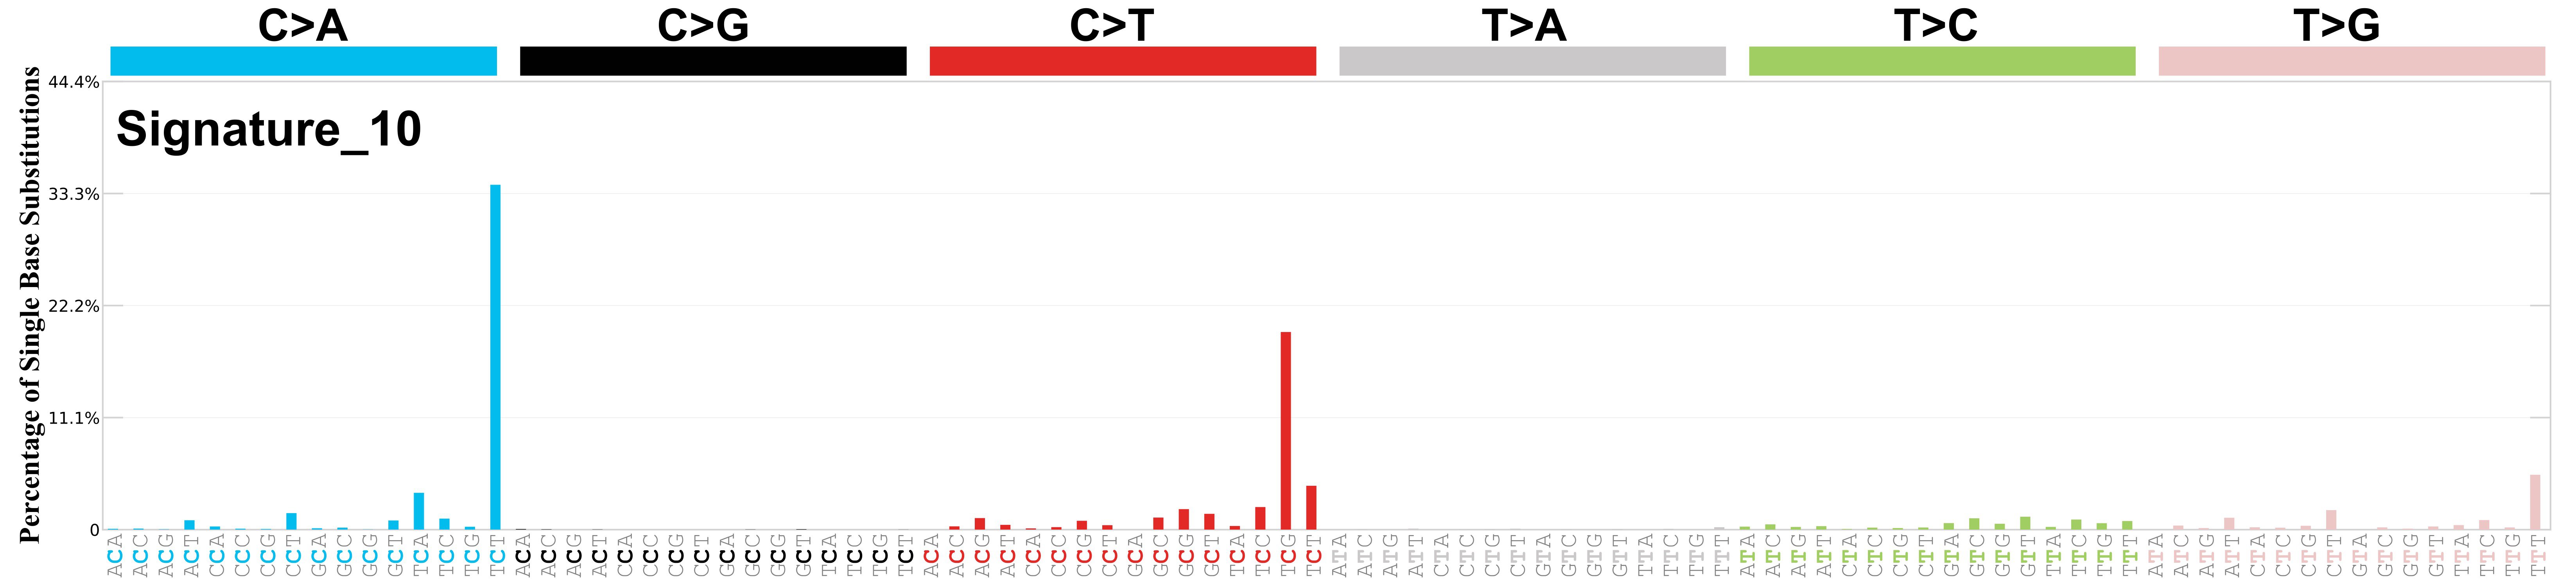
Mutational profile

Genome: GRCh37

Genome: GRCh38

Genome: mm9

Genome: mm10

Genome: rn6
Mutational profile using the conventional 96 mutation type classification. This classification is based on the six substitution subtypes: C>A, C>G, C>T, T>A, T>C, and T>G, as well as the nucleotides immediately 5’ and 3’ to the mutation.
Each of the substitutions is referred to by the pyrimidine of the mutated Watson—Crick base pair. Incorporating information on the bases immediately 5’ and 3’ to each mutated base generates 96 possible mutation types (6 types of substitution x 4 types of 5’ base x 4 types of 3’ base). Mutational signatures are displayed and reported based on the observed trinucleotide frequency of the genome, i.e., representing the relative proportions of mutations generated by each signature based on the actual trinucleotide frequencies of the corresponding reference genome.
Proposed aetiology
Adenoma from individuals with germline POLD1 exonuclease domain mutations.
Comments
Strong lagging replication strand bias. Enriched in non-coding genome (intergenic and intronic) regions.
Acceptance criteria
| Background | Identification study | First included in COSMIC | |
|---|---|---|---|
| Robinson et al. 2021 Nature Genetics | v3.2 | ||
| Identification | NGS technique | Different variant callers | Multiple sequencing centres |
| WGS | No | No | |
| Technical validation | Validated in orthogonal techniques | Replicated in additional studies | Extended context enrichment |
| Yes | No | - | |
| Proposed aetiology | Mutational process | Support | |
| Defective POLD1 proofreading | Statistical association | ||
| Experimental validation | Experimental study | Species | |
| - | - | ||
Summary of the technical and experimental evidence available in the scientific literature regarding the validation of the mutational signature.
Tissue distribution
Adenoma from individuals with germline POLD1 exonuclease domain mutations.
Associated signatures
Differences between current and previous profiles

Genome: GRCh37

Genome: GRCh38

Genome: mm9

Genome: mm10

Genome: rn6
Replication timing
Topography analysis could not be performed for replication timing as the number of mutations satisfying our constraints was insufficient or this signature was not yet analysed.
Nucleosome occupancy
Topography analysis could not be performed for nucleosome occupancy as the number of mutations satisfying our constraints was insufficient or this signature was not yet analysed.
CTCF occupancy
Topography analysis could not be performed for CTCF occupancy as the number of mutations satisfying our constraints was insufficient or this signature was not yet analysed.
Histone modifications
Topography analysis could not be performed for histone modifications as the number of mutations satisfying our constraints was insufficient or this signature was not yet analysed.
Transcriptional strand asymmetry
Topography analysis could not be performed for transcriptional strand asymmetry as the number of mutations satisfying our constraints was insufficient or this signature was not yet analysed.
Genic and intergenic regions
Topography analysis could not be performed for genic and intergenic region asymmetry as the number of mutations satisfying our constraints was insufficient or this signature was not yet analysed.
Replicational strand asymmetry
Topography analysis could not be performed for replicational strand asymmetry as the number of mutations satisfying our constraints was insufficient or this signature was not yet analysed.
Strand-coordinated mutagenesis
Topography analysis could not be performed for strand-coordinated mutagenesis as the number of satisfying our constraints was insufficient or this signature was not yet analysed.