
Mutational Signatures (v3.6 - May 2026)
ID17 · GRCh37 · COSMIC v104
Mutational profile

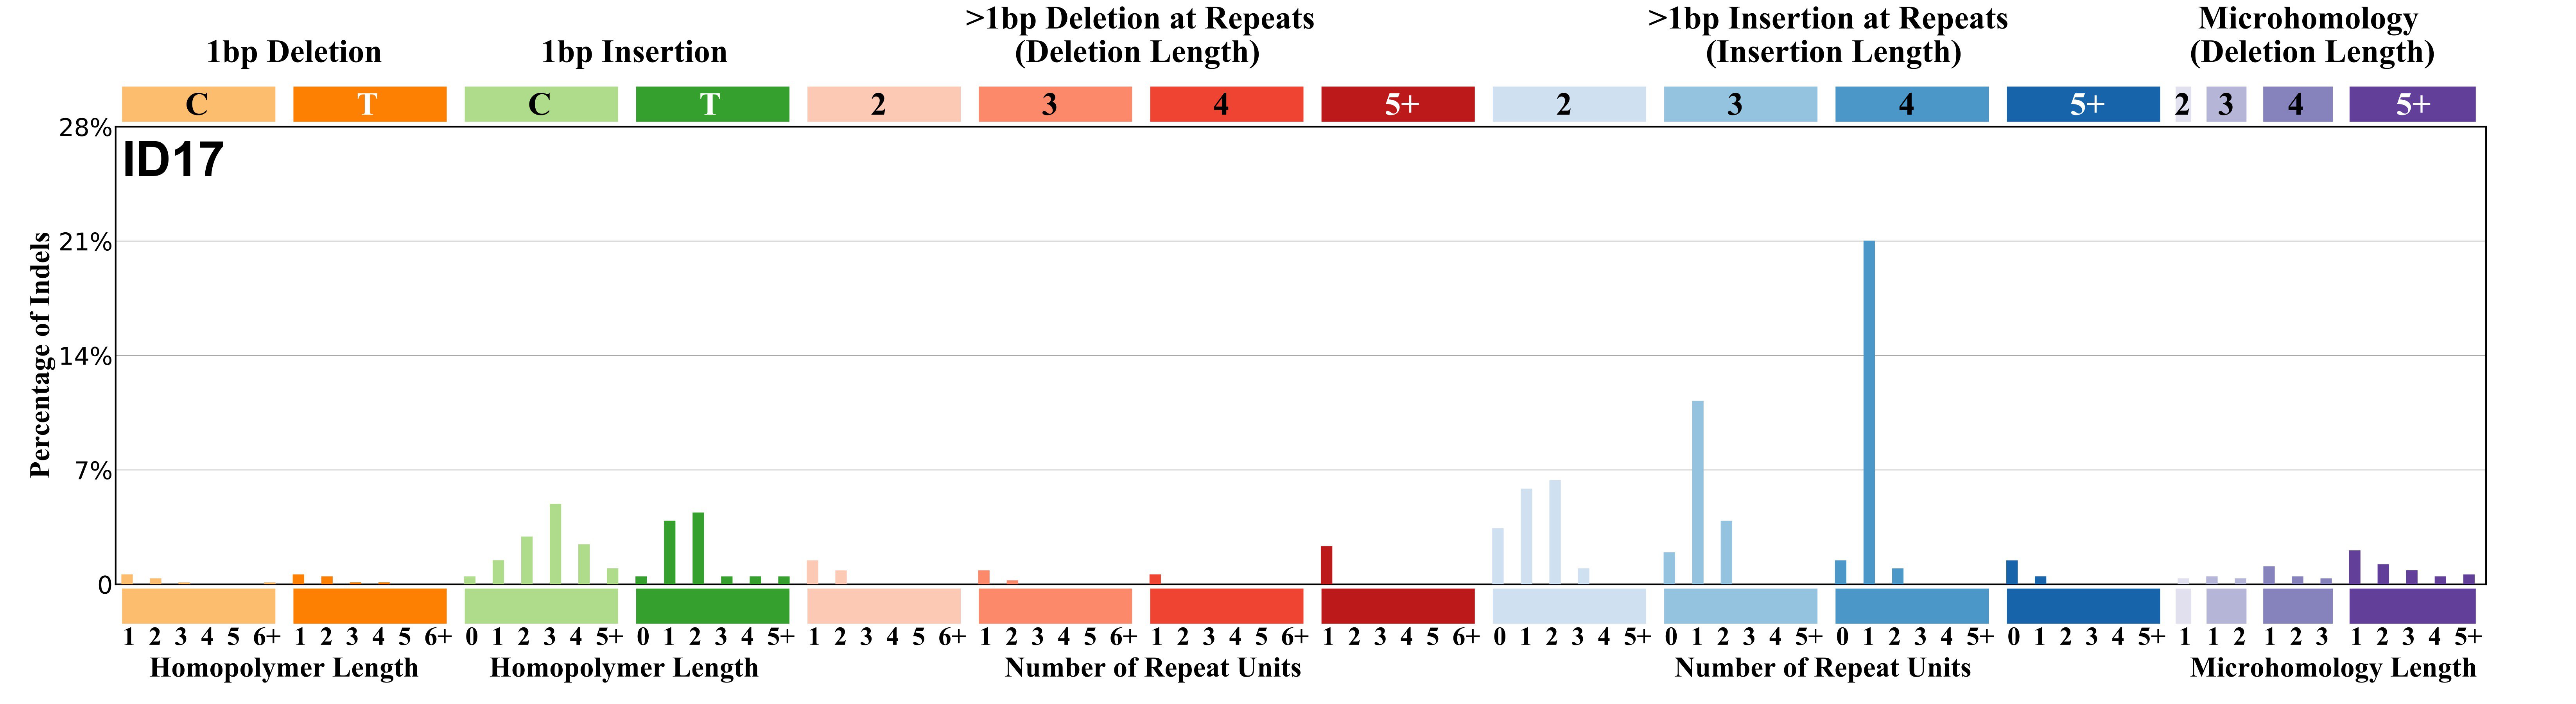
The height of each mutational profile bar represents the proportion of one ID mutation type among all ID mutation types in the signature. Although there is no single intuitive and naturally constrained set of ID mutation types (as there arguably are for SBSs and DBSs), an 83 subclass categorisation of ID mutations was designed.
The 83 ID classification incorporates the prior knowledge that IDs commonly have sizes of 1-10 bps, that both insertions and deletions exist, that IDs of C and T occur at different rates, that IDs preferentially occur at repetitive elements, that the length of the repeat unit may influence the likelihood of an ID occurring, that the number of repeat units in a repeat stretch may influence the likelihood of an ID occurring, that IDs are also fostered in some instances by overlapping sequence microhomologies at the ID boundaries and that different mutational processes may, in principle, be differently influenced by these features. We therefore designed an 83 subclass categorisation of IDs that allows some exploration of all the above possibilities, while constraining the number of categories in order to accommodate the relatively small numbers of IDs (compared to substitutions) found in most genomes. This classification categorises IDs of lengths from 1bp to >5bp, for 1bp IDs classifies them as T or C and the number of single base repeats they occur in from 0 to >5, categorises lengths of non-single base repeat units from 2bp to >5bp and the number of repeats from 1 to >5 and size of microhomology from 0bp to >5bp. We recognise that different classifications of IDs may be preferred by others. The ID mutation types are enumerated in the following Excel document.
Proposed aetiology
Appears to be caused by mutations in topoisomerase TOP2A. All tumours with ID17 have the somatic TOP2A p.K743N mutation, and tumours with this mutation have ID17. ID17 exhibits probable transcription-associated damage as evidenced by higher mutation density in more highly expressed genes. Studies of topoisomerase variants in yeast support the connection between TOP2A and ID17.
Comments
ID17 generates a large number of indels in a small number of cancers without obvious evidence of defective DNA mismatch repair.
Acceptance criteria
| Background | Identification study | First included in COSMIC | |
|---|---|---|---|
| Alexandrov et al. 2020 Nature | v3 | ||
| Identification | NGS technique | Different variant callers | Multiple sequencing centres |
| WES & WGS | Yes | Yes | |
| Technical validation | Validated in orthogonal techniques | Replicated in additional studies | Extended context enrichment |
| Yes | Yes | - | |
| Proposed aetiology | Mutational process | Support | |
| TOP2A mutation | Experimental confirmation | ||
| Experimental validation | Experimental study | Species | |
| Stantial et al. 2020 PNAS | Yeast | ||
Summary of the technical and experimental evidence available in the scientific literature regarding the validation of the mutational signature.
Tissue distribution
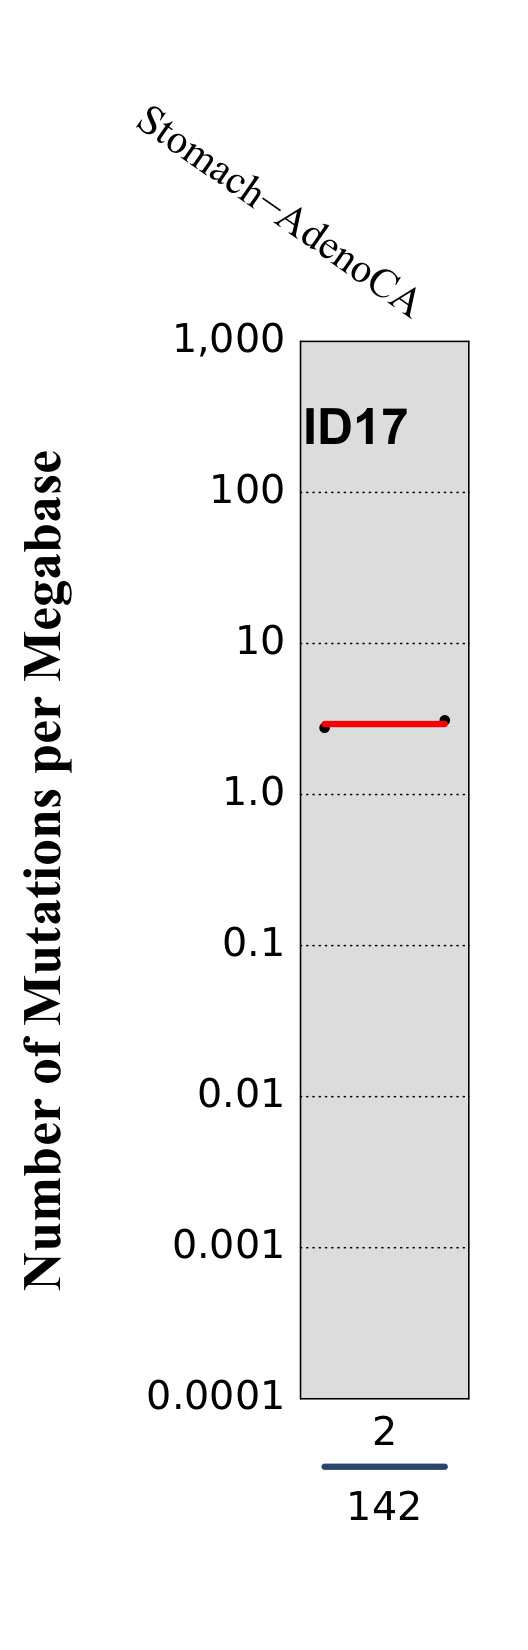
Numbers of mutations per megabase attributed to the mutational signature across the cancer types in which the signature was found. Each dot represents an individual sample and only samples where the signature is found are shown. The number of mutations per megabase was calculated by assuming that an average whole-exome has 30 Mb with sufficient coverage, whereas an average whole-genome has 2,800 Mb with sufficient coverage.
The numbers below the dots for each cancer type indicate the number of high confidence tumours in which the signature was attributed (above the blue horizontal line) and the total number of high confidence tumours analysed (below the blue horizontal line). Only high confidence data are displayed: samples with reconstruction accuracy >0.90.
Associated signatures
The TOP2A p.K743N mutation also appears to be responsible for some instances of ID8.
Replication timing

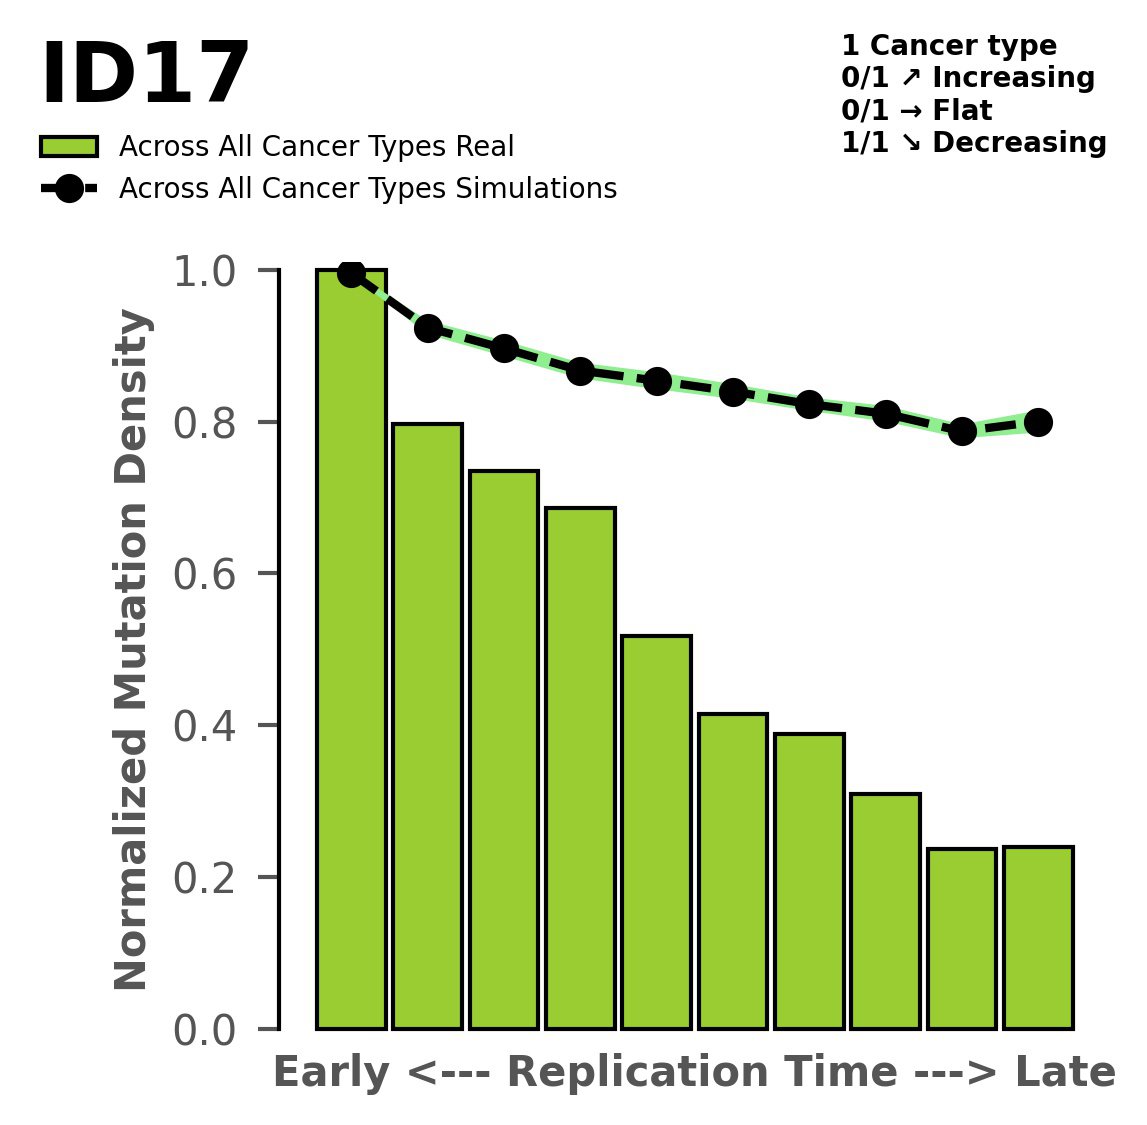
Tissue: aggregated across 1 tissues

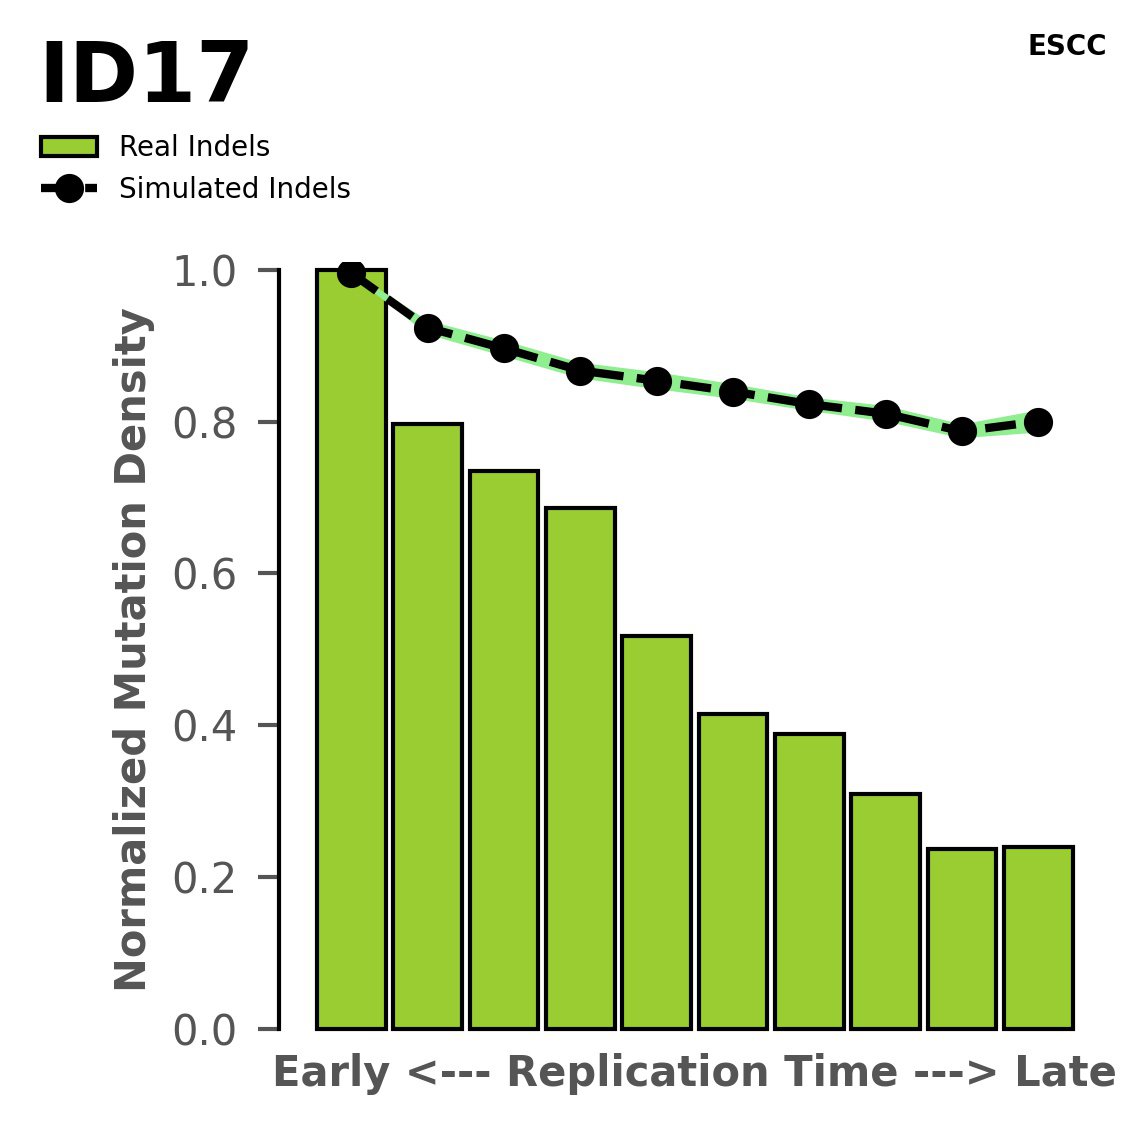
Tissue: ESCC (Esophageal Squamous Cell Carcinoma)
Normalised mutational densities from early to late replicating regions in the human genome are shown with respect to real somatic mutations and simulated mutations. The dashed line reflects the behaviour of simulated mutations, whereas the bars represent the behaviour for real somatic mutations.
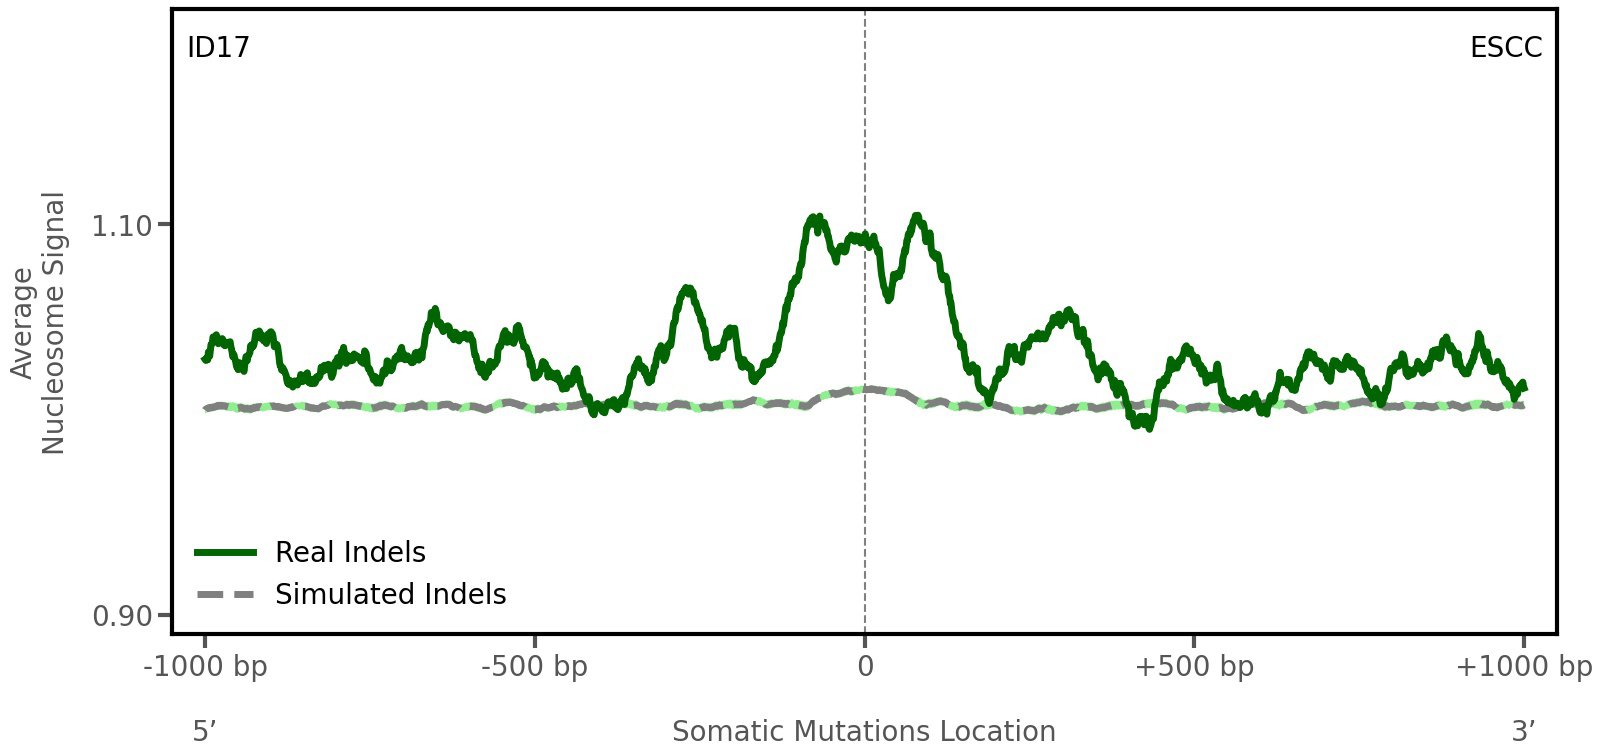
Nucleosome occupancy

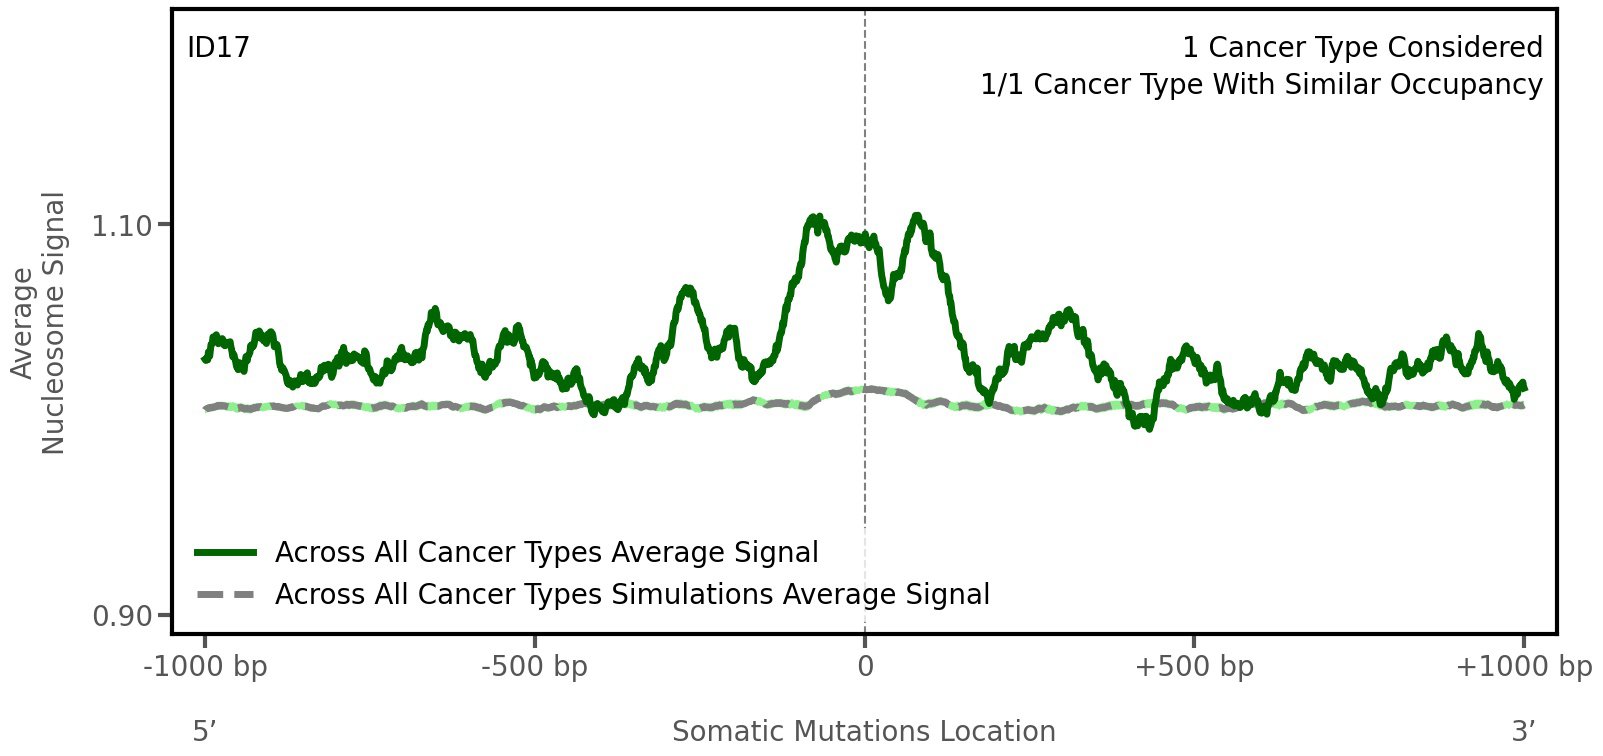
Tissue: aggregated across 1 tissues

Tissue: ESCC (Esophageal Squamous Cell Carcinoma)
Average nucleosome signal along a 2 kilobase window centred at the somatic mutation (dashed vertical line). The solid blue line shows the average nucleosome signal for real mutations, whereas the dashed line shows the average nucleosome signal for simulated somatic mutations. A higher signal reflects a higher propensity for nucleosome occupancy.
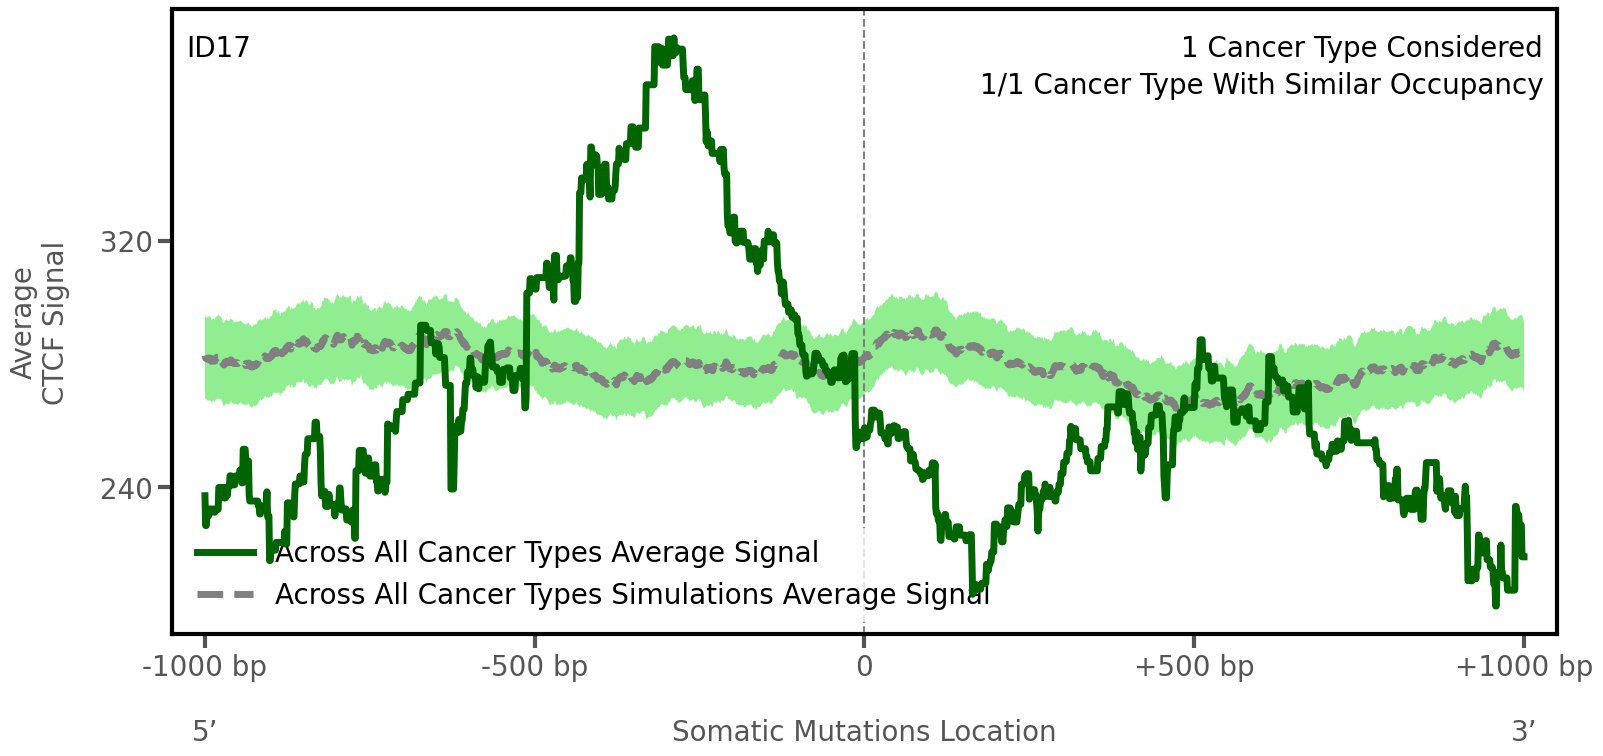
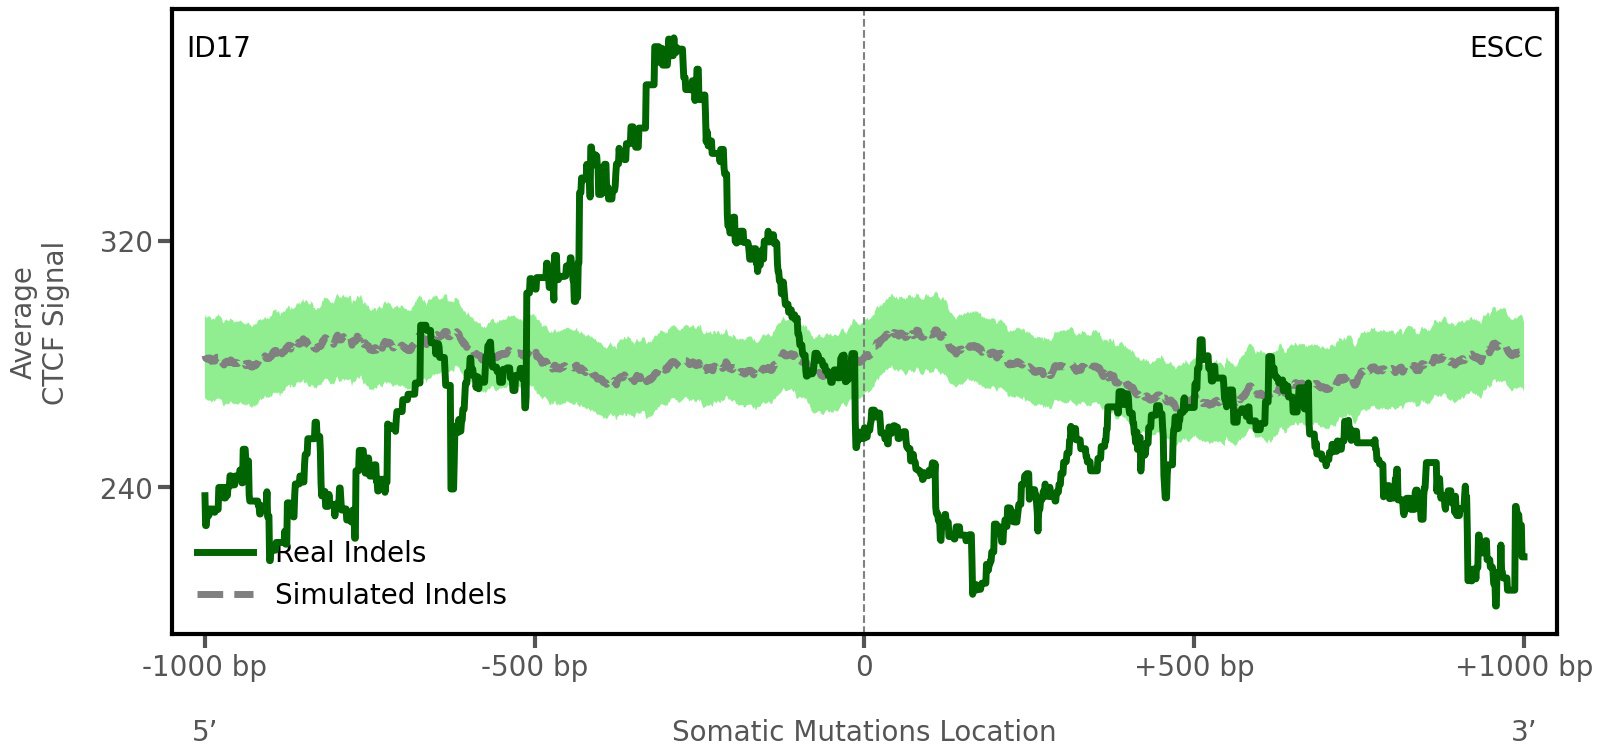
CTCF occupancy

Tissue: aggregated across 1 tissues

Tissue: ESCC (Esophageal Squamous Cell Carcinoma)
CCCTC-binding factor (CTCF) is a multi-functional, sequence-specific transcription factor encoded by the CTCF gene. It can function as a transcriptional activator, a repressor, or an insulator protein by blocking the communication between enhancers and promoters.
This plot shows the average CTCF signal along a 2 kilobase window centered at the somatic mutation (dashed vertical line). The blue solid line shows the average CTCF signal for real mutations, whereas the dashed line shows the average CTCF signal for simulated mutations. A higher signal reflects a higher propensity for CTCF binding.
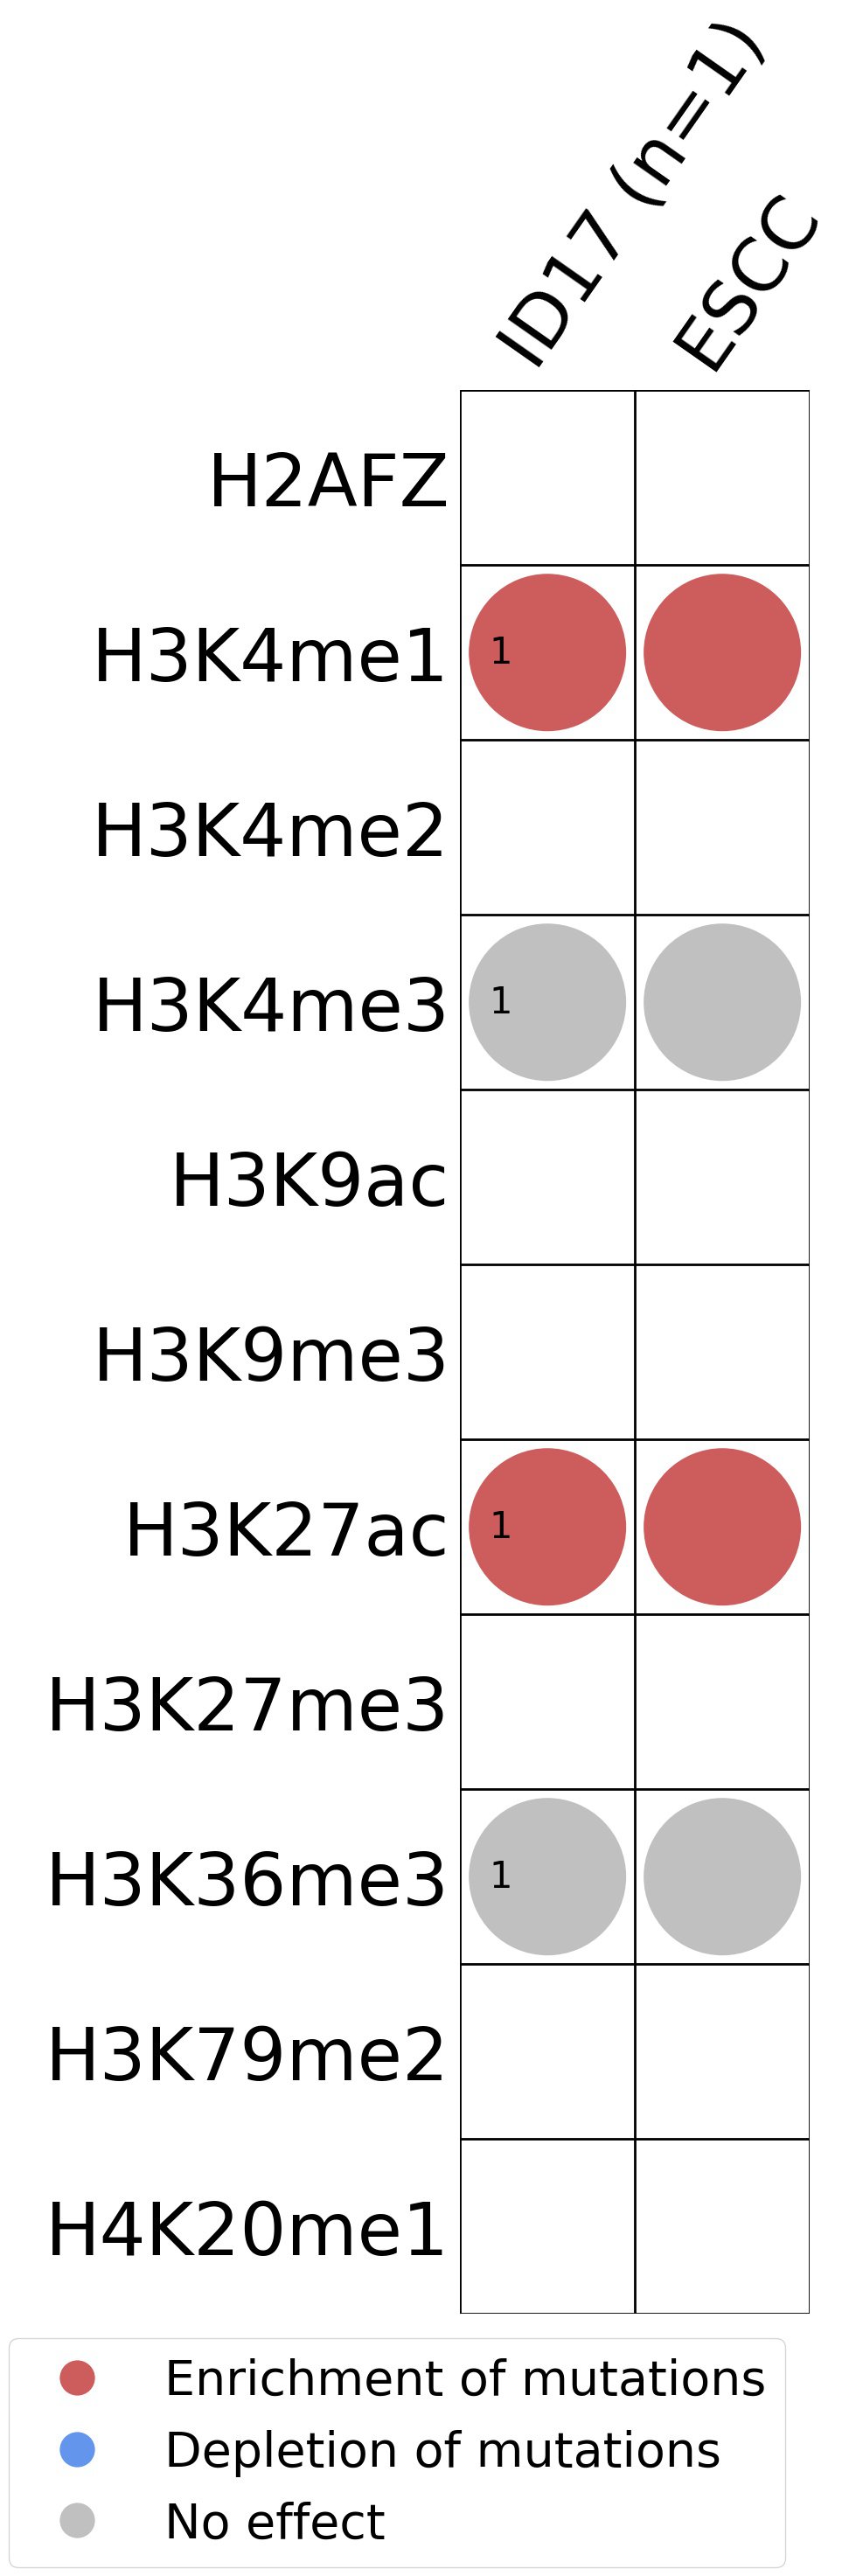
Histone modifications

This plot shows the associations between mutational signatures and histone marks. Pie charts display the number of cancer types that are either enriched, depleted, or have no statistical effect for a given mutational signature and a specific histone mark. Differential changes are calculated by statistically comparing the of average signals between real and simulated mutations using a 100 base window centered at the somatic mutation. Enrichments reflect at least 5% statistically significant increases in real signal when compared to simulated signal. Depletions reflect at least 5% statistically significant decreases in real signal when compared to simulated signal. Statistical significance is determined based on false-discovery rate corrected p-value below 0.05.
(i) H2AFZ, a replication-independent member of the histone H2A family that renders chromatin accessible at enhancers and promoters and regulates transcriptional activation and repression; (ii) H3K4me1, histone mark often associated with enhancer activity; (iii) H3K4me2, a histone post-translational modification enriched in cis-regulatory regions, including both enhancers and promoters; (iv) H3K4me3, post-translational modification enriched in active promoters near transcription start sites; (v) H3K9ac, associated with active gene promoters and active transcription; (vi) H3K9me3, typical mark of constitutive heterochromatin; (vii) H3K27ac, histone modification generally contained at nucleosomes flanking enhancers; (viii) H3K27me3, repressive, associated with silent genes; (ix) H3K36me3, associated with transcribed regions and playing a role in regulating DNA damage repair; (x) H3K79me2, detected in the transcribed regions of active genes; and (xi) H4K20me1, found in gene promoters and associated with gene transcriptional elongation and transcription activation.
Transcriptional strand asymmetry
Topography analysis could not be performed for transcriptional strand asymmetry as the number of mutations satisfying our constraints was insufficient or this signature was not yet analysed.
Genic and intergenic regions
Topography analysis could not be performed for genic and intergenic region asymmetry as the number of mutations satisfying our constraints was insufficient or this signature was not yet analysed.
Replicational strand asymmetry
Topography analysis could not be performed for replicational strand asymmetry as the number of mutations satisfying our constraints was insufficient or this signature was not yet analysed.