

Mutational Signatures (v3.6 - May 2026)
DBS10 · GRCh37 · COSMIC v104
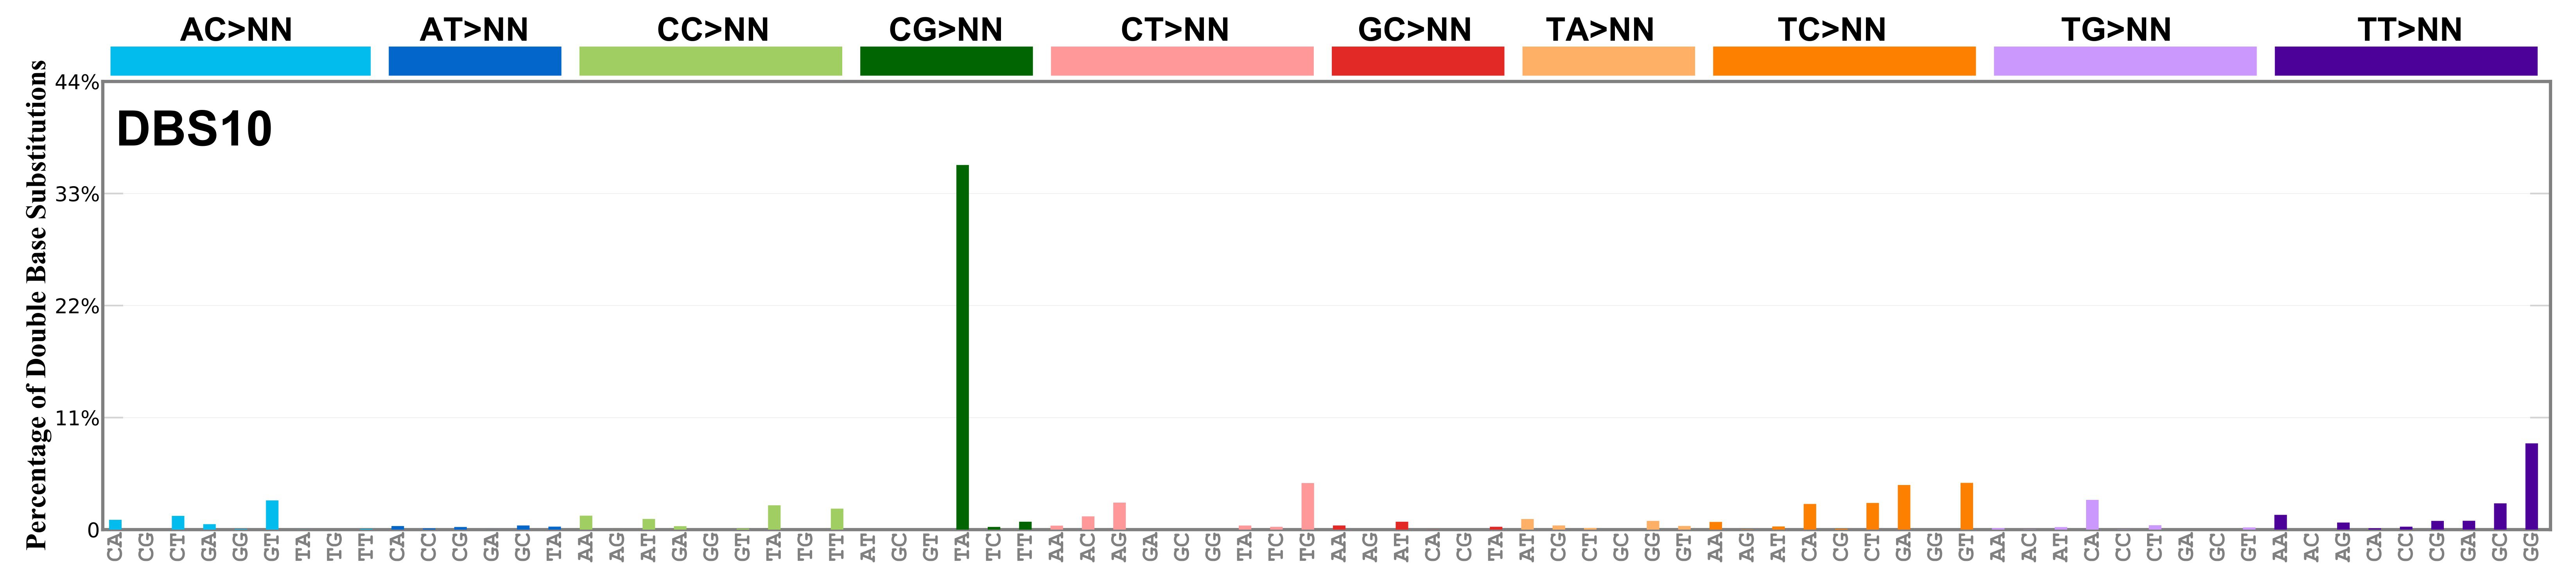
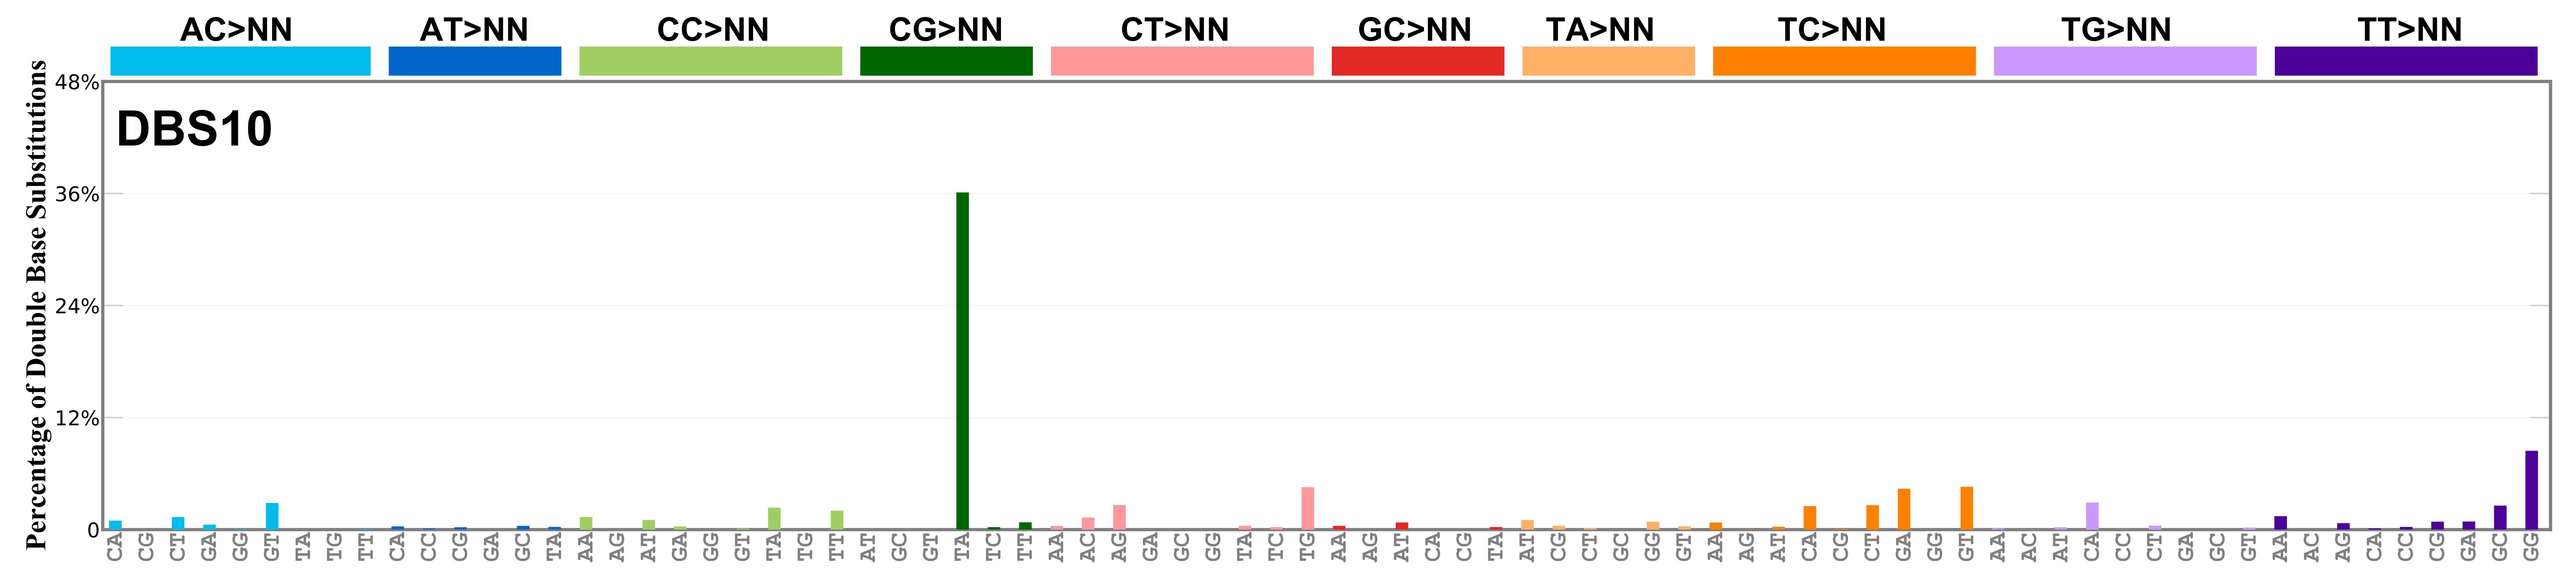
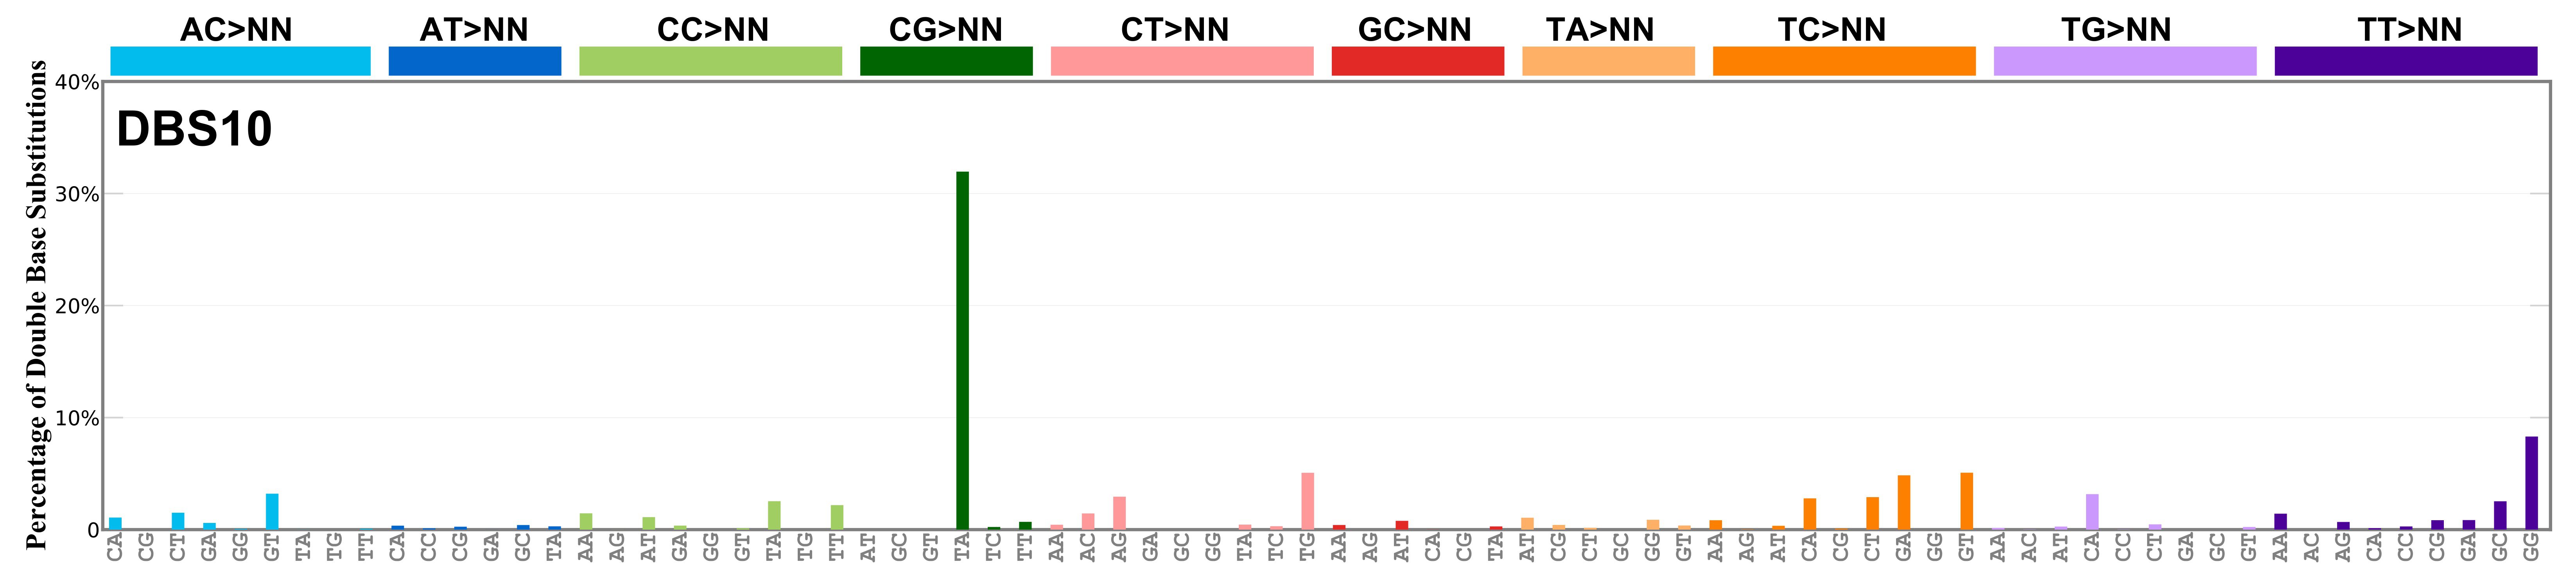
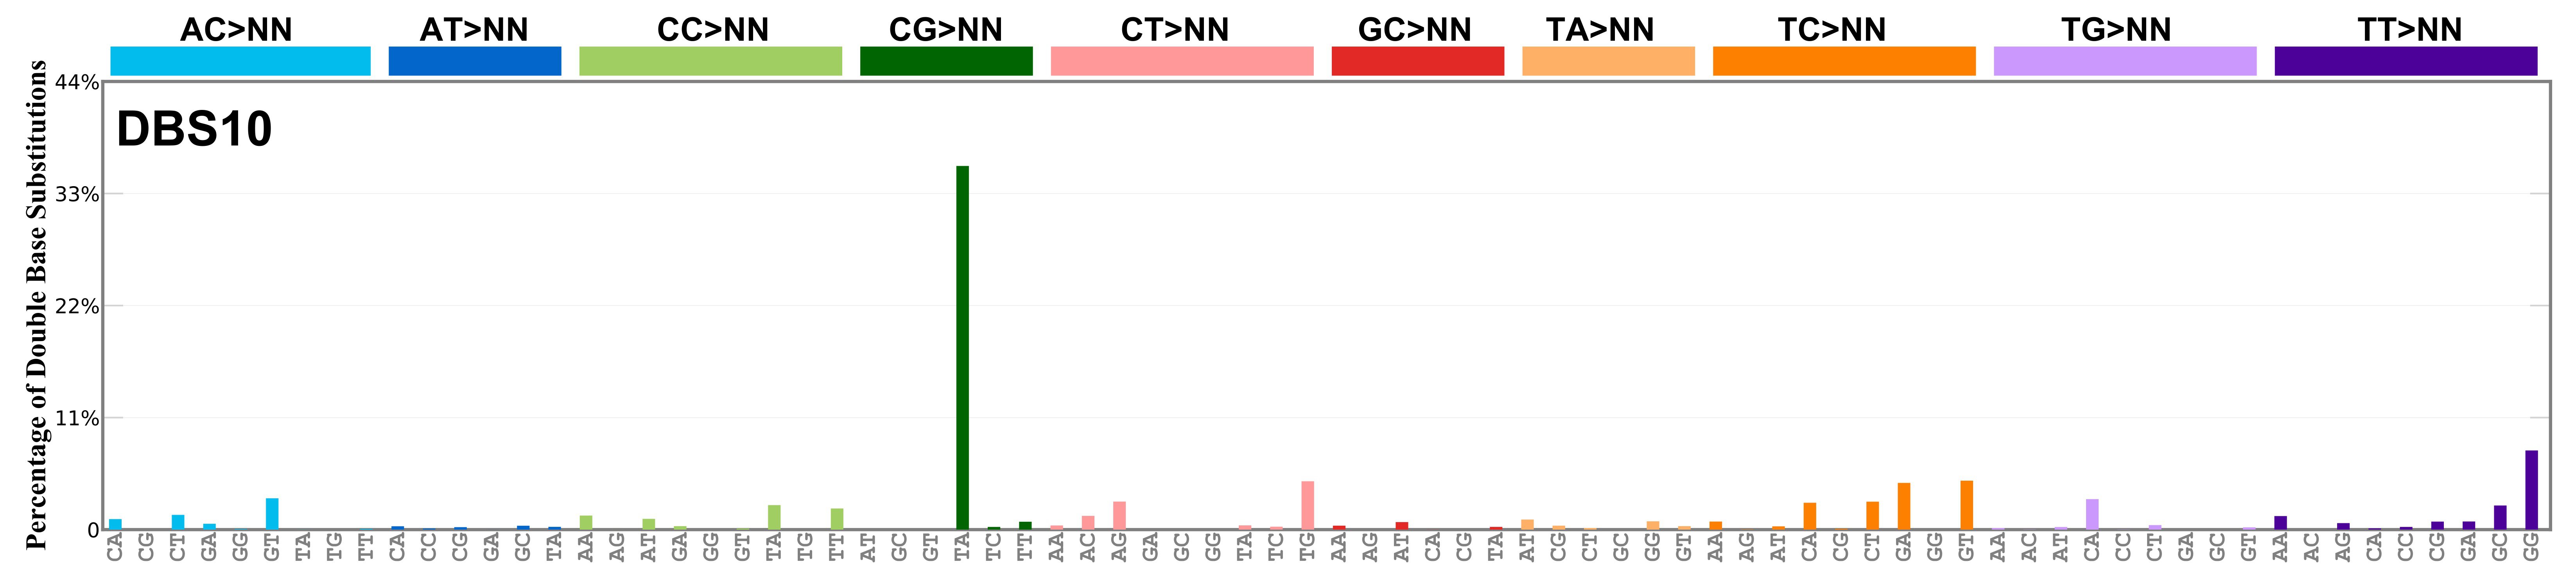
Mutational profile

Genome: GRCh37

Genome: GRCh38

Genome: mm9

Genome: mm10

Genome: rn6
Proportion of a particular doublet base substitution (DBS) mutation type among all DBS mutation types in the signature is represented by the height of each bar. There are 78 strand-agnostic DBS mutation types.
The reason there are 78 strand-agnostic DBS mutation types is as follows. First, there are 4 x 4 = 16 possible source doublet bases. Of these, AT, TA, CG, and GC are their own reverse complement. We can represent the remaining 12 as 6 possible strand-agnostic doublets (e.g. AC represents both AC and its reverse complement, GT). Thus, there are 4+6=10 source doublet bases. Because they are their own reverse complements, AT, TA, CG, and GC can each be substituted by only 6 doublets . For example, AT can be substituted by 3 doublets starting with C: CA, CC, CG. But AT can be substituted by only 2 doublets starting with G: GA and GC. This is because the mutation from AT>GG is already represented by its reverse complement, AT>CC. Similarly AT can be substituted by only 1 doublet starting with T: TA. This is because AT>TC is represented by its reverse complement, AT>GA, and AT>TG is represented by AT>CA. For the remaining doublets, which are not their own reverse-complements, there are 3 x 3 = 9 possible DBS mutation types. Thus, in total there are 4 x 6 + 6 x 9 = 78 strand-agnostic DBS mutation types (see enumeration in the accompanying Excel document).
Proposed aetiology
Defective DNA mismatch repair.
Acceptance criteria
| Background | Identification study | First included in COSMIC | |
|---|---|---|---|
| Alexandrov et al. 2020 Nature | v3 | ||
| Identification | NGS technique | Different variant callers | Multiple sequencing centres |
| WGS | Yes | Yes | |
| Technical validation | Validated in orthogonal techniques | Replicated in additional studies | Extended context enrichment |
| Yes | Yes | - | |
| Proposed aetiology | Mutational process | Support | |
| MMR deficiency | Statistical association | ||
| Experimental validation | Experimental study | Species | |
| - | - | ||
Summary of the technical and experimental evidence available in the scientific literature regarding the validation of the mutational signature.
Tissue distribution
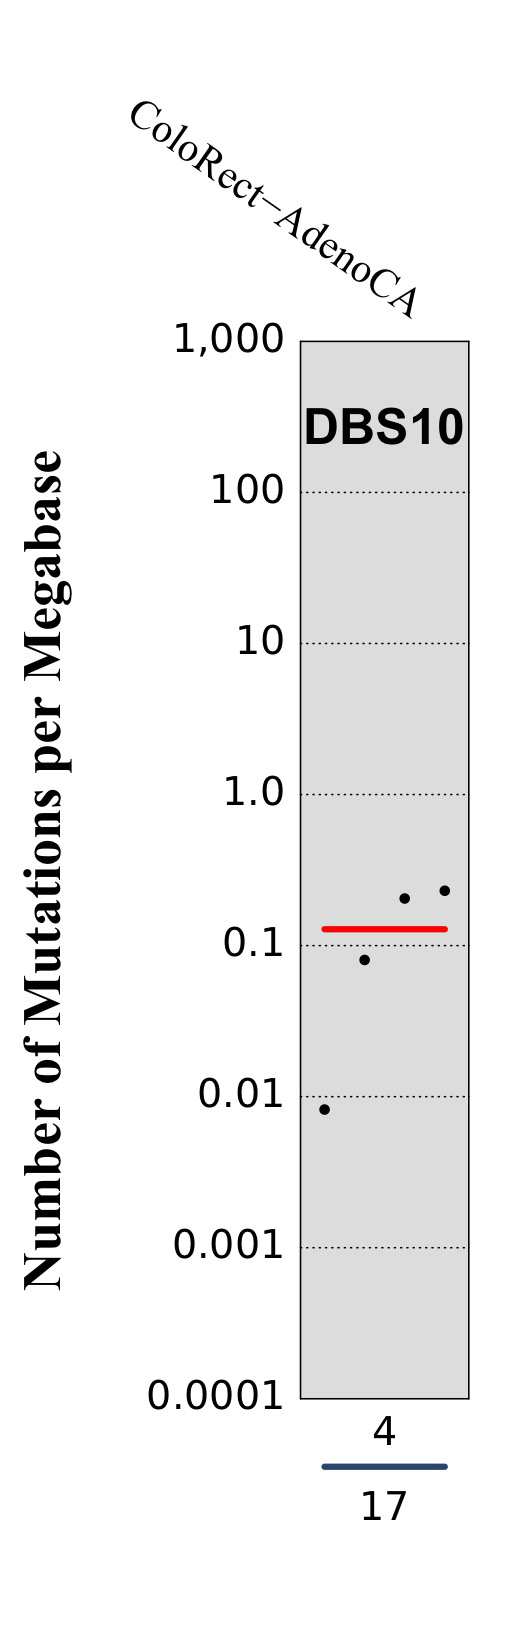
Numbers of mutations per megabase attributed to the mutational signature across the cancer types in which the signature was found. Each dot represents an individual sample and only samples where the signature is found are shown. The number of mutations per megabase was calculated by assuming that an average whole-exome has 30 Mb with sufficient coverage, whereas an average whole-genome has 2,800 Mb with sufficient coverage.
The numbers below the dots for each cancer type indicate the number of high confidence tumours in which the signature was attributed (above the blue horizontal line) and the total number of high confidence tumours analysed (below the blue horizontal line). Only high confidence data are displayed: samples with reconstruction accuracy >0.90.
Associated signatures
DBS10 mutations are present in high numbers in most samples in which it has been observed. DBS10 is associated with some of the single base substitution mutational signatures present in DNA mismatch repair deficient cancers SBS6, SBS14, SBS15, SBS20, SBS21, SBS26, and SBS44, and with large numbers of ID1 and ID2 mutations.
Replication timing
Topography analysis could not be performed for replication timing as the number of mutations satisfying our constraints was insufficient or this signature was not yet analysed.
Nucleosome occupancy
Topography analysis could not be performed for nucleosome occupancy as the number of mutations satisfying our constraints was insufficient or this signature was not yet analysed.
CTCF occupancy
Topography analysis could not be performed for CTCF occupancy as the number of mutations satisfying our constraints was insufficient or this signature was not yet analysed.
Histone modifications
Topography analysis could not be performed for histone modifications as the number of mutations satisfying our constraints was insufficient or this signature was not yet analysed.
Transcriptional strand asymmetry
Topography analysis could not be performed for transcriptional strand asymmetry as the number of mutations satisfying our constraints was insufficient or this signature was not yet analysed.
Genic and intergenic regions
Topography analysis could not be performed for genic and intergenic region asymmetry as the number of mutations satisfying our constraints was insufficient or this signature was not yet analysed.
Replicational strand asymmetry
Topography analysis could not be performed for replicational strand asymmetry as the number of mutations satisfying our constraints was insufficient or this signature was not yet analysed.